What makes a good chocolate bar?
STA/ISS 313 - Project 1
Abstract
In this project, our team decided to analyze the Chocolate Bar Ratings data set provided by the Flavors of Cacao online database. Our project seeks to answer to key questions: where the highest-reviewed chocolate is produced and what ingredients comprise the chocolate with highest reviews. The visualizations are central to our project; we hope to clearly demonstrate our findings with our plots and show the trends within our data. In addition, we will include in-depth discussions of our approach and method and include why our analysis was performed the way it was. Lastly, we will discuss the trends present in our plots and connect our chocolate data to bigger themes and events that may have been going on at the same time.
Introduction
For our first project, our team decided to analyze the Chocolate Bar Ratings data set, which comes from the Flavors of Cacao database provided by Georgios and Kelsey (two contributors to the TidyTuesday repository). Since chocolate is such a ubiquitous substance in America, our team decided to use this dataset because we were mildly interested in learning more about chocolate and the details about where it is produced and how the different ingredients affect its perceived review.
Within the dataset, there are categorical variables such as ingredients and the country of bean origin, and there are numerical variables such as the cocoa percentage and the review score rating of the chocolate. The review scores of the chocolate are on a scale of 1.0 to 4.0 and combine a mixture of both objective and subjective factors. By the end of this project, our team will have used a combination of these variables to create visualizations that reveal more about the intricacies of chocolate production and review.
Question 1: Where is the best chocolate produced?
Introduction
For this question, we specifically want to explore how chocolate bar ratings for bars originating from different countries are impacted by factors like time and cocoa percentage. While dozens of countries are represented in the data, we referenced statistics from the International Cocoa Organization to find that 81% of the market share for fine aroma cocoa is owned by Latin America, with the top four countries of production being Ecuador, Dominican Republic, Peru, and Venezuela (Gómez-García Palao and Vignati 2016). We will use these four countries to answer our question, as identified in the country_of_bean_origin variable. Additionally, we will make use of the review_date, cocoa_percent, and rating variables. We are interested in this question because many chocolate bars boast their country of origin on the wrapper, and we would love to know which is frequently associated with the highest rated chocolate!
Approach
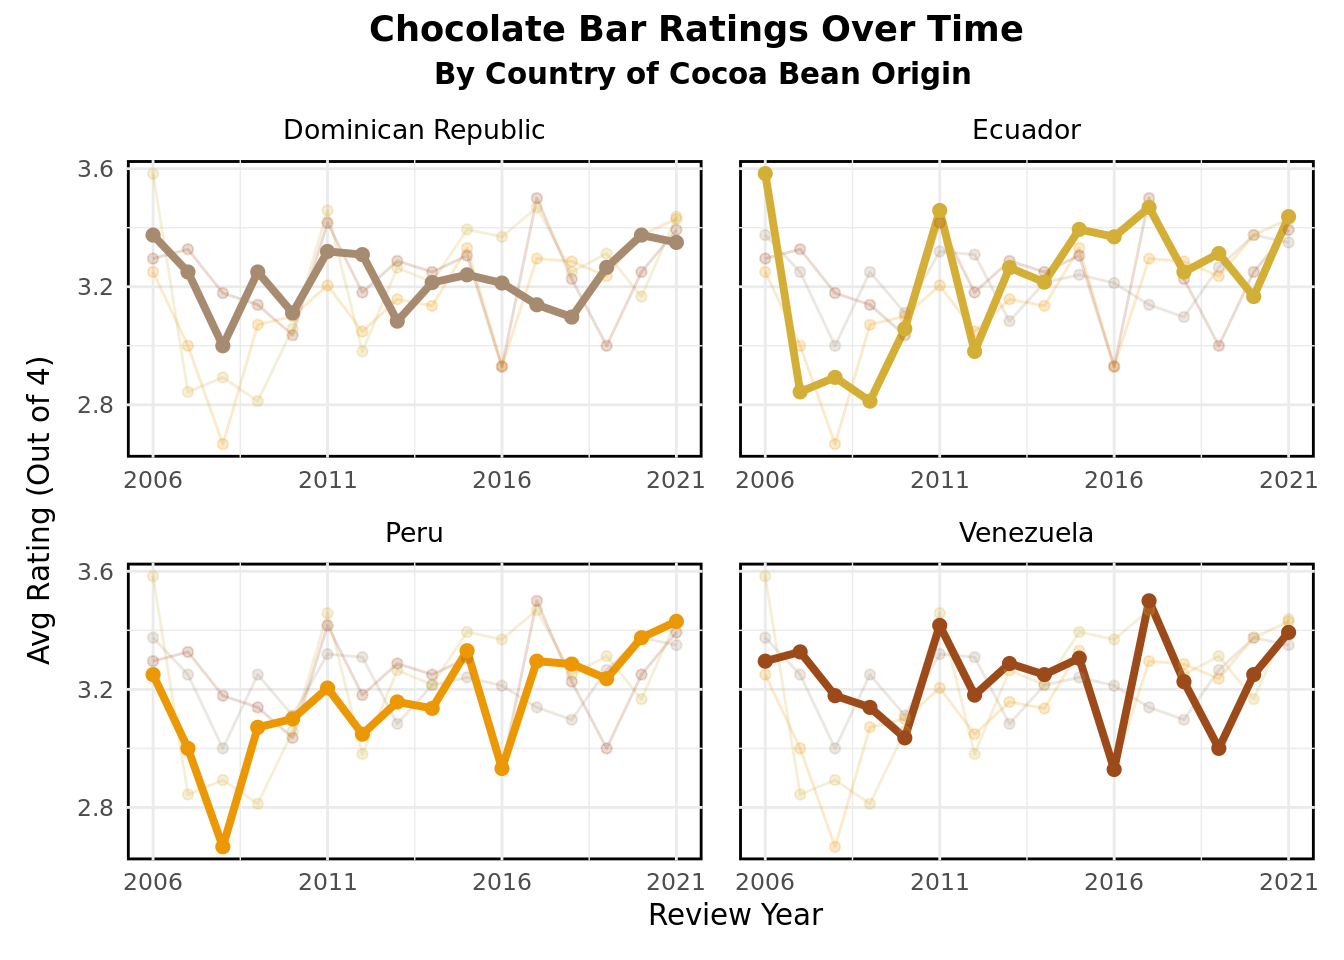
To visualize the chocolate bar ratings over time for the four countries in question, we have chosen to calculate the mean rating for each country for each year in the data (2006-2021), then produce a faceted line plot with color mapping. The line plot offers an intuitive way to visualize an effect over time, with the year on the x-axis, to see how ratings have changed over the 15-year period. Using a single line plot felt somewhat cluttered, so we opted to split the plot into four line plots, each highlighting a different country, such that it can be visualized against the others. This allows for easy comparison across the four countries without the clutter and overlap of a single line plot.
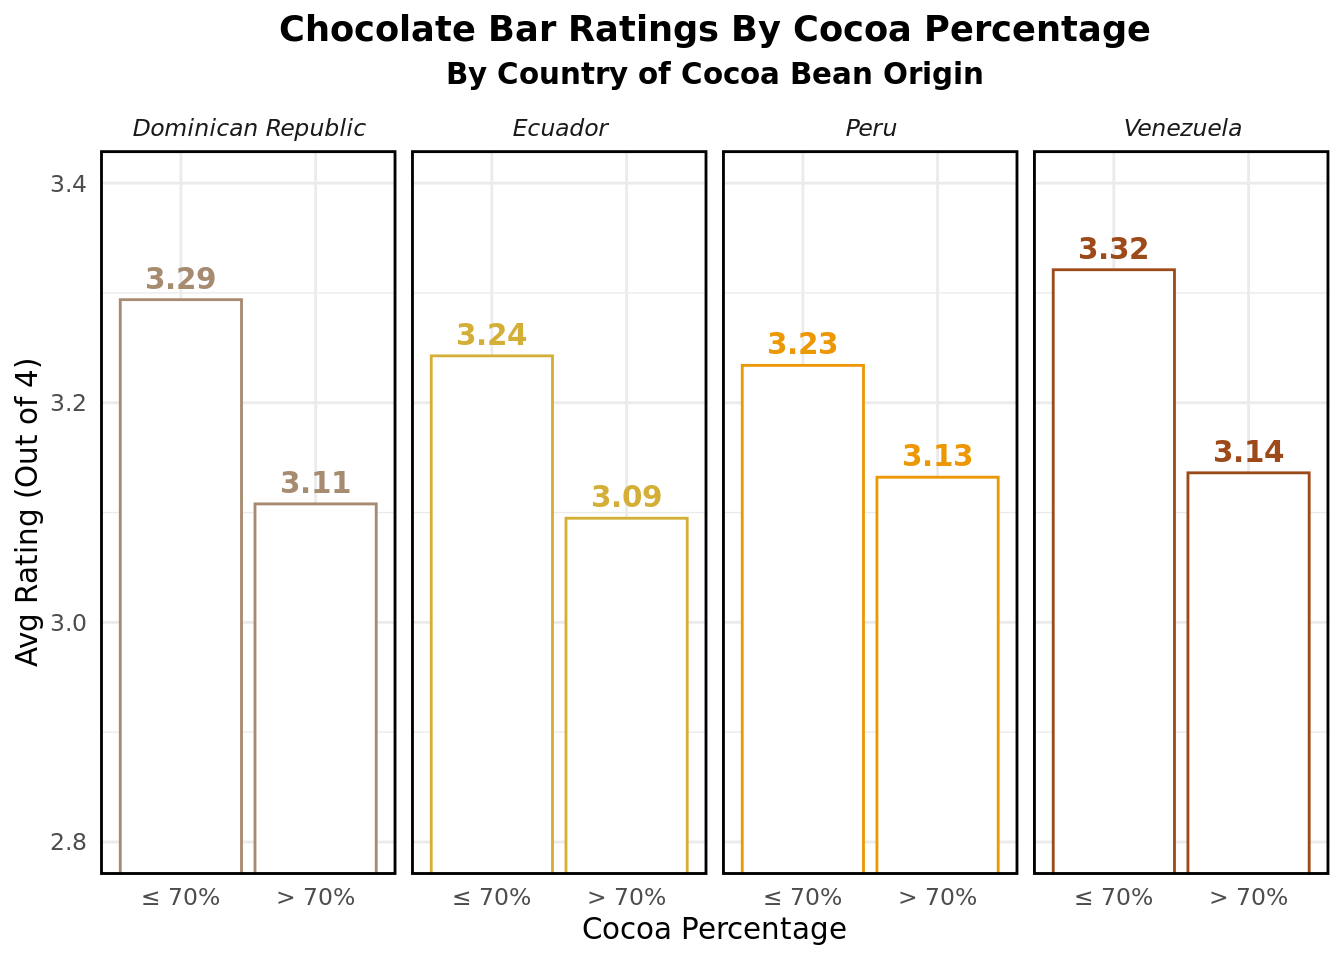
To visualize the effect of cocoa percentage on chocolate bar ratings for the four countries, we decided to produce bar plots of rating vs. cocoa percentage, faceted by the country of origin. While cocoa percentage was originally a continuous variable, we found that a cocoa percentage of 70% is an important marker for chocolate, often serving as the indicator for whether it is classified as milk or dark (Moskin 2008; Greatist Food Editors 2021). Therefore, we created a categorical variable for whether a chocolate bar has greater than or less than 70% cocoa. Numeric labels have been added at the top of the bars to provide viewers with an easy way to read the average rating for each group of chocolate bars. This format with all four countries side-by-side allows for easy comparison across the four countries, and for the two cocoa percentage categories. Color mapping has also been added that is consistent with the first plot.
Analysis
Discussion
The first visualization reveals that chocolate bars with beans from the four countries of origin (Dominican Republic, Ecaudor, Peru, Venezuela) all experienced decreases in their average chocolate ratings over the first few years in the plot, namely 2006 to 2008. This perhaps could be due to the global recession of 2008, which may have affected manufacturing/production quality and therefore decreased customer satisfaction of chocolate bars coming from these four countries at the time.
After this stretch of 3-4 years from 2006, all four of these countries experience a rebound in chocolate bar ratings, with minor dips in the future years; however, none of these decreases in ratings parallel the dip around 2008, both in magnitude and length of the decreasing ratings, except in Venezuela and Peru. Venezuela was facing record-high inflation levels (800% at its peak) and this explosion in inflation roughly started in 2016, which would definitely affect the production and shipment of Venezuelan cocoa beans around the world. Peru is a nation facing great political turmoil, which can also be traced back to 2016. A nation facing political distress will suffer in terms of its GDP and exports, which could potentially reflect the considerable drop in average ratings chocolate bars made from Peruvian cocoa beans.
The second visualization demonstrates that chocolate bars with beans originating from these four countries, regardless of which country, had higher average ratings if the cocoa percentage was below 70% as opposed to above 70%. This difference was the greatest in chocolate bars with beans originating from Venezuela, with a 0.18 average rating difference between the greater than 70% cocoa bars vs below 70% cocoa bars. This doesn’t surprise our team, as a higher cocoa level gives the chocolate bar a harsher, more bitter taste, and people generally enjoy the sweeter kinds of chocolate candies. One statistic our team is interested in is even if most people generally like chocolate with lower cocoa percentage levels, how would the ratings differ if only people who liked dark chocolate (let’s say greater than 70% cocoa percentage) rated the different dark chocolate bars from around the world? Our team would hypothesize that there may be a different trend there if we only analyzed that sentiment and not just the general average reviews of lighter vs darker chocolate bars.
Question 2: What does the best chocolate contain?
Introduction
For this question, we are interested in exploring some of the main ingredients present in many chocolate bars, and specifically answering the question - how do the number of ingredients and presence of ingredients such as sweeteners, vanilla, cocoa butter, or beans affect chocolate bar ratings, and how have these relationships changed over time? The ingredients variable in the dataset includes abbreviations that indicate the presence of common ingredients in each chocolate bar, as well as a number indicating how many of these ingredients are present. We will create distinct indicator variables for each ingredient that indicate their presence in each chocolate bar. Other relevant variables for this question are the chocolate bar rating, on a scale of 1 to 4, and the date that the chocolate bar was reviewed, a year from 2006 to 2021. This question is interesting and relevant, because it is advantageous to know which ingredients correspond with higher chocolate bar ratings, and it could be fascinating to know if and how these opinions have changed over time. When browsing chocolate bars in the store, this analysis can give someone a better idea of which ones will be the best!
Approach
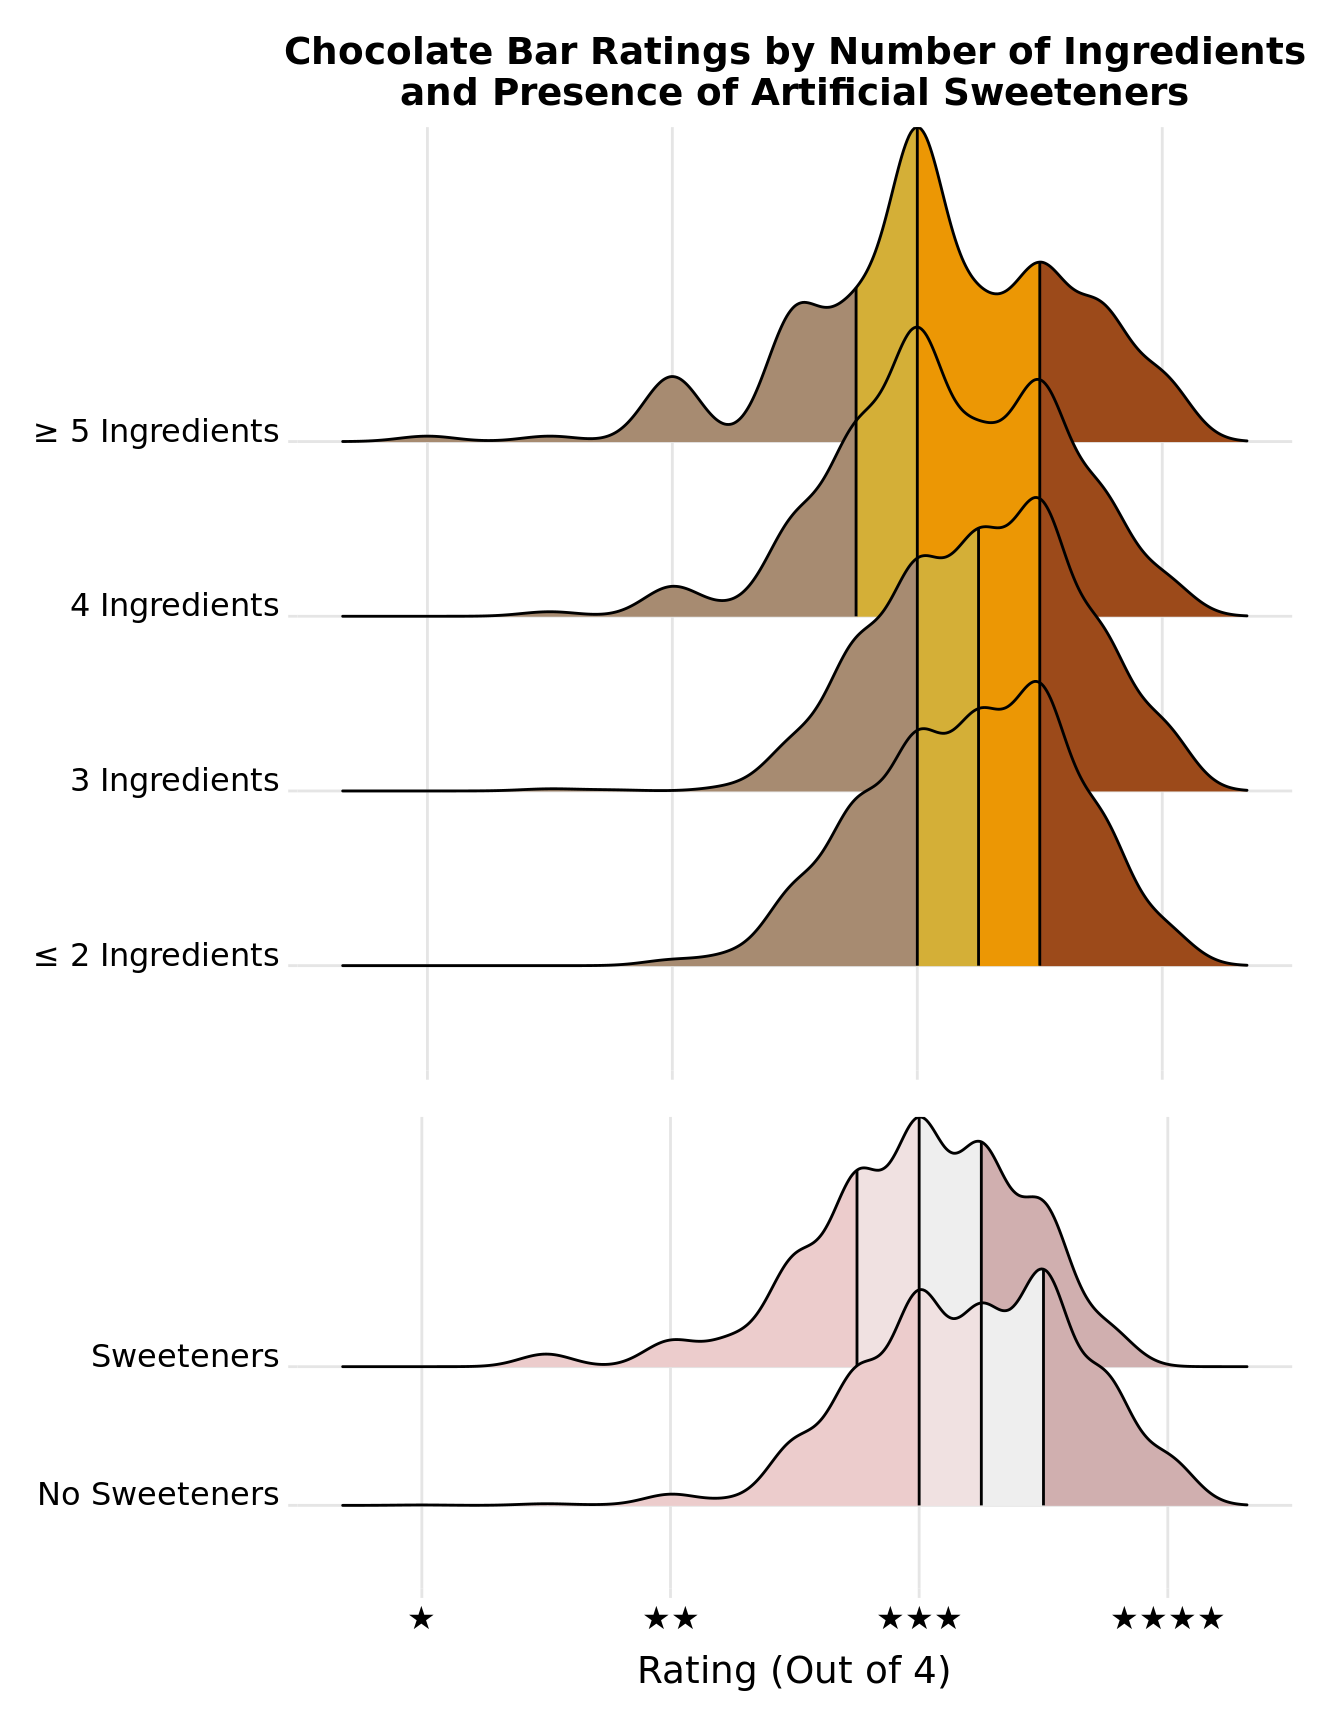
To first visualize the distribution of ratings for chocolate bars with different numbers of ingredients, we decided to make a ridgeline plot to easily compare the distributions and their respective medians and quartiles. Additionally, we identified the presence of sweeteners (other than natural sugar) as a key ingredient that distinguishes certain chocolates, so the rating distributions for chocolate bars with and without artificial sweeteners have been included on the same visualization. Additionally, we have colored the different quartiles in each ridge to easily visualize which groups have higher medians, first quartiles, and third quartiles. It is important to note that the number of ingredients in the plot is the number of key ingredients present out of the 7 represented in the data: Beans, Sugar, Sweetener, Cocoa Butter, Vanilla, Lecithin, and Salt. As there were very few instances of chocolate bars with 1, 6, and 7 ingredients in the dataset, we created four groupings to be able to generate meaningful distributions while still being inclusive of all data points.
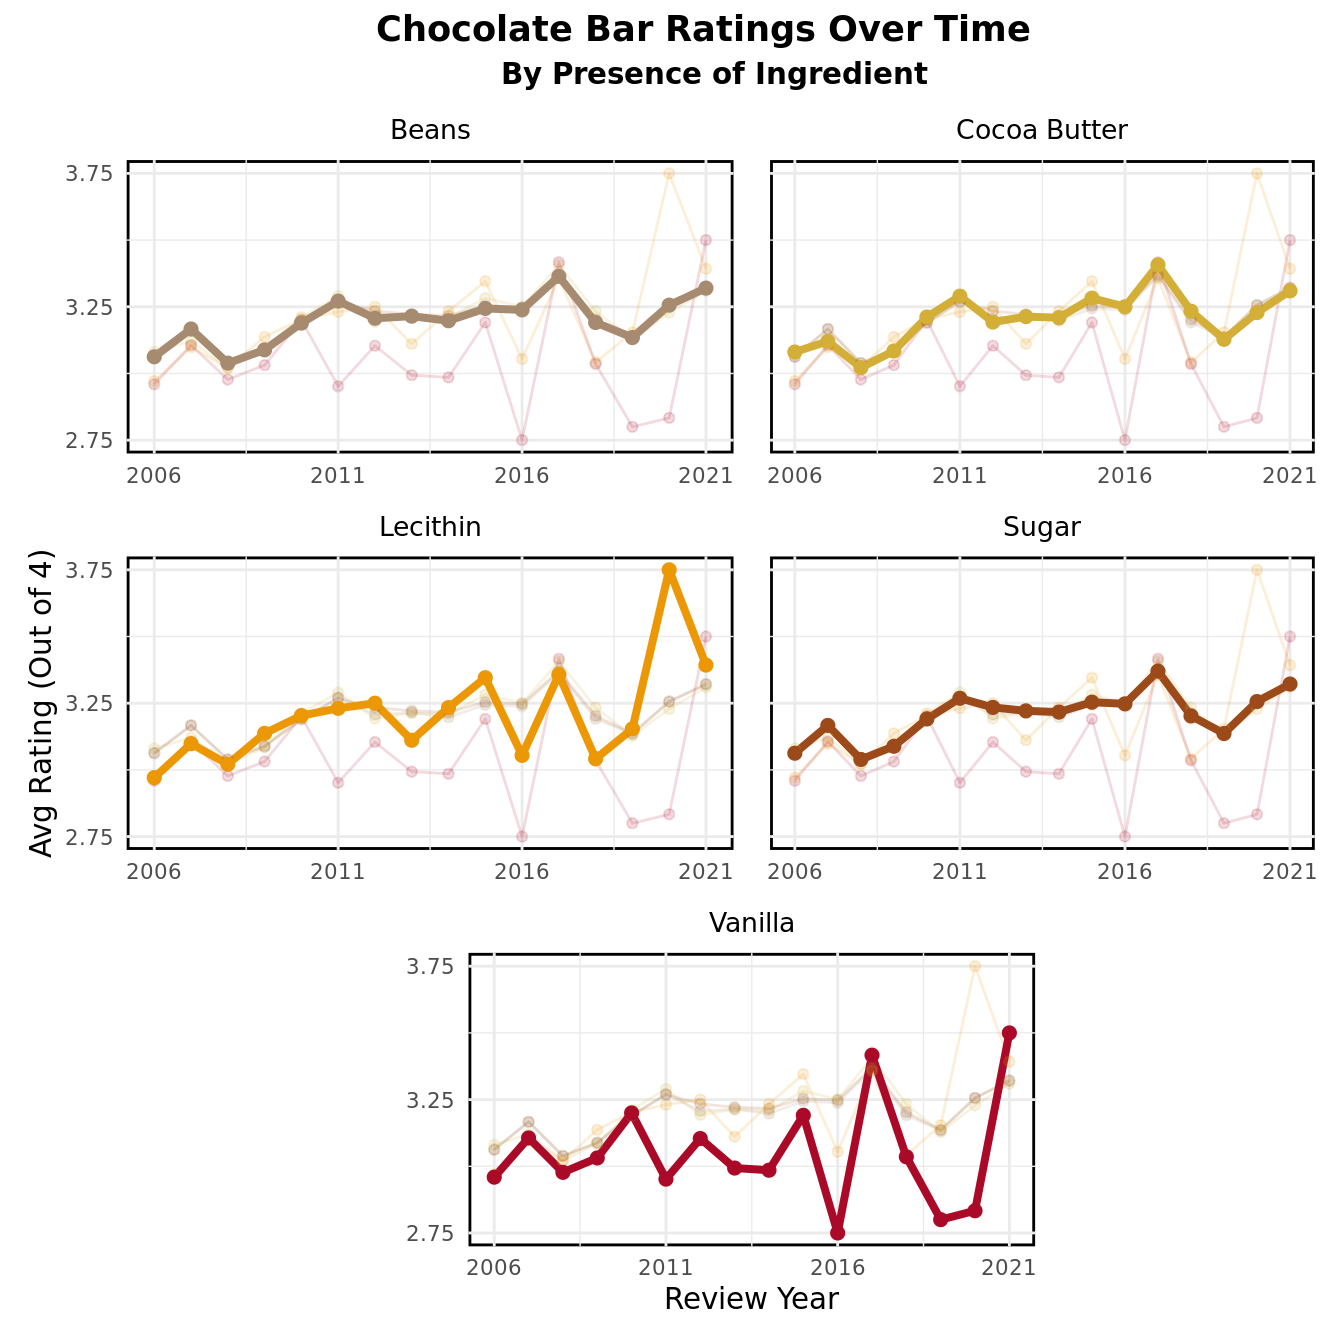
Next, to visualize how the ratings of different chocolate bar ingredients have changed over time, a line plot will be used and separated by ingredient, with each plot highlighting a different ingredient. A line plot is an effective way to visualize a relationship over time, since the intuitive nature of the lines from left to right tracks the chocolate ratings over time. The average ratings will be calculated for each ingredient for each year in the dataset to construct the lines. Color mapping will be used as an easy way to identify each ingredient and compare their mean ratings to the rest of the ingredients, as well as how they have changed over time. As there were some years with no chocolate bars containing salt or sweetener, these ingredients were omitted from the visualization; their line plots would not have been as meaningful due to very low amounts of observations.
Analysis
Discussion
The ridgeline plot provides insight into the distribution of chocolate bar ratings for those containing different numbers of the key ingredients (Beans, Sugar, Sweetener, Cocoa Butter, Vanilla, Lecithin, and Salt), as well as those with and without sweeteners. Through the coloring of the different quartiles, it appears that chocolate bars containing fewer key ingredients tend to have higher ratings, on average, as the first and second quartiles were slightly greater for bars containing three or fewer ingredients, as opposed to four or more ingredients. It is possible that fewer ingredients leads to a “simpler” chocolate bar that appeals to a wide audience, and thus is appreciated more by reviewers. Having more ingredients may create a more niche or flavored chocolate bar that does not achieve the same widespread appreciation.
The lower section of the ridgeline plot shows that chocolate bars without sweeteners tend to receive higher ratings than chocolate bars with sweeteners, on average. The median rating and all quartiles are greater for chocolate bars without sweeteners, and they appear to have a greater minimum and maximum. This suggests that reviewers tend to appreciate a more natural chocolate bar that does not make use of additional sweeteners. The inclusion of sweeteners may create a more artificial-tasting chocolate that is not as well-received by its consumer.
The second plot uses line plots to visualize the change in average rating over time for chocolate bars featuring different key ingredients, namely Cocoa Beans, Cocoa Butter, Lecithin, Sugar, and Vanilla. While the plots for all five ingredients demonstrate some inconsistency over the 15 year period, the overall trend is that chocolate bar ratings have increased from 2006 to 2021 for all ingredients. Chocolate bars with Cocoa Beans, Cocoa Butter, and Sugar all demonstrated relatively steady increases across the 15 year period, while those with Vanilla and Lecithin (a common food additive) were more sporadic. This is likely due to Cocoa Beans, Cocoa Butter, and Sugar being much more common in chocolate bars, while Vanilla and Lecithin are not as prevalent. Another interesting takeaway is that chocolate bars with Vanilla had the lowest average rating in 2006, yet the highest average rating in 2021, however it is unclear whether this is a significant insight since the line plot for vanilla has many inconsistencies.