The Hypocrisy of US Corporate Pride and Anti-LGBTQ+ Donations
STA/ISS 313 - Project 1
Abstract
All of the members of our team are strong advocates for LGBTQ+ rights, and we are all very intrigued by the prevalence of corporate Pride supporters who also hypocritically donate to anti-LGBTQ+ political campaigns. While there has been growing support for the LGBTQ+ community in the U.S. and increased discussion on human rights, diversity, and inclusion, there is still much more progress needed. Many companies have publicly opposed anti-LGBTQ+ bills and shown support for LGBTQ+ employees, yet some of them simultaneously fund lawmakers who back anti-LGBTQ+ agendas. In particular, in 2021, the newspaper “Popular Information” found that 25 companies who were publicly in support of the Pride movement have also donated $13M to politicians who back anti-LGBTQ+ bills (The 19th). We believe this is dishonest behavior that deserves attention so that more people are aware of these hypocritical practices. Furthermore, politicians are undoubtedly vital to policy reform that supports the LGBTQ+ community, however, there has been a significant amount of funding going towards politicians who are anti-LGBTQ+. If we want positive and real change to uplift the LGBTQ+ community, we need greater governmental support for Pride and less for anti-LGBTQ+ politicians. In summary, for this project, we want to delve into two key players in the Pride and anti-LGBTQ+ movements– companies and politicians– to understand how both stakeholders are associated with anti-LGBTQ+ campaigns that undermine progress to empower the U.S. LGBTQ+ community.
Introduction
The datasets we are using are from TidyTuesday and are drawn from Data For Progress, which is a think tank and polling firm that provides data for progressive campaigns, causes, and candidates. Their work has been used by US representatives, senators, and local leaders, and it has even been cited by the White House. The datasets in this TidyTuesday are looking specifically at businesses that contribute to the campaigns of politicians who have anti-LGBTQ beliefs. It includes seven datasets: static_list, contribution_data_all_states, pride_aggregates, fortune_aggregates, pride_sponsors, donors, and corp_by_politician. We found overlapping data in static_list, fortune_aggregates, and pride_aggregates. Static_list captured the most complete information from fortune_aggregates and pride_aggregates combined, so we decided to use static_list. Our decision to use contribution_data_all_states was made for similar reasons. In many ways it is a combination of the others in terms of information and variables, but we appreciated that it included that information by individual contribution rather than by company or politician totals. Finally, we also decided to use the corp_by_politician dataset to have information on the offices and titles each politician holds.
The first dataset we are using is static_list, containing information on 126 companies (each row corresponds to a company) and whether they donated to Pride, if they have an HRC business pledge, the dollar amount contributed across states (in USD), the number of politicians contributed to, and the number of states where they made contributions. It has 6 columns/variables. A few of the variables we are using from this dataset for our analysis include Company, Pride?, HRC Business Pledge, and Amount Contributed Across States. The second dataset is contribution_data_all_states with 13210 observations with each row denoting a single donation/contribution along with information on the company it was made by, whether or not they were a Pride and sponsor match, if they were a Pride event sponsor, HRC business pledge, donor name, politician donated to, state donated to, amount of donation (in USD), date, citation, donor type, comments, and an archive. It has a total of 13 columns/variables. Some of the variables we are using to answer our research questions from this dataset are Politician, Date, and Amount. The last dataset is corp_by_poltician, which has information on 103 politicians and a total of 4 variables, including the politician’s name, state, total amount of contributions received from corporations, and title. For this dataset, we are particularly interested in looking at politician Title.
Question 1: What is the relationship between a company’s status as a Pride sponsor, whether they have an HRC pledge or not, and their contributions to anti-LGBTQ+ political campaigns?
Introduction
The Human Rights Campaign (HRC) business pledge is a commitment for companies to show their clear opposition to harmful legislation aimed at restricting the access of LGBTQ+ identifying people in society and the workplace. As of 2023, 296 companies have already signed the pledge (HRC). As awareness of various sexual identities have increased in the past few years, we are curious to see if there are businesses who publicly support the LGBTQ+ community through events and pledges but who also secretly contribute to politicians with anti-LGBTQ+ campaigns. We would hope that companies who support the LGBTQ+ community would not also make anti-LGBTQ+ donations, but this is not the case. Therefore, we want to compare company contribution amounts and public-facing LGBTQ+ support to shed light on patterns associated with these categorizations.
For this question, we will be using the static_list dataset and not contribution_data_all_states or corp_by_politician. From static_list, we will be using the HRC Business Pledge, Pride?, Company, and Amount Contributed Across States variables.
Approach
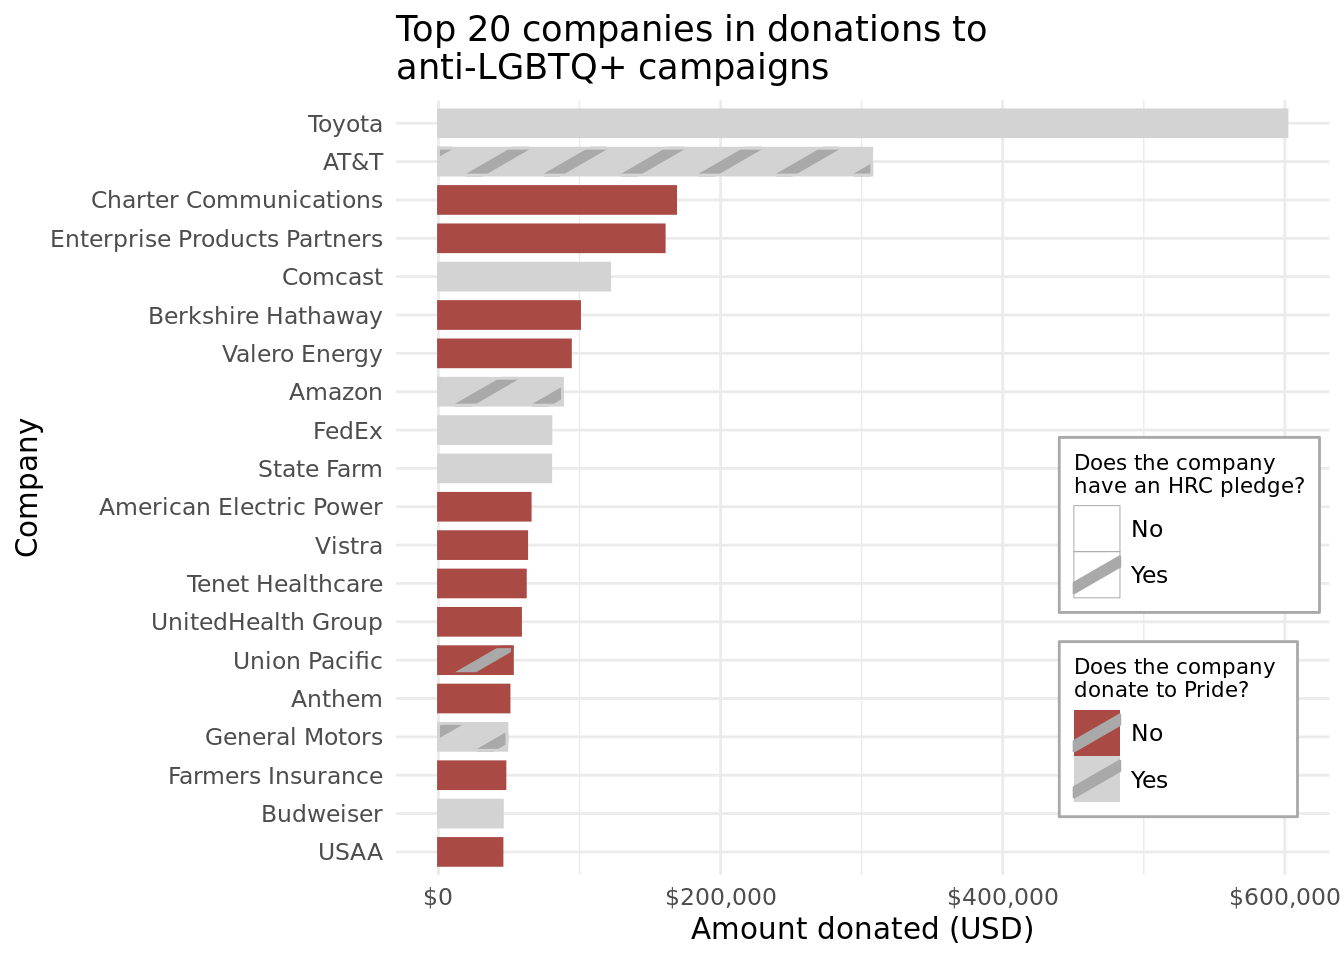
To answer our question, we will create a barplot and a density plot. Our first plot, the barplot, will include the top 20 companies that contributed to anti-LGBTQ+ political campaigns and show how much each company contributed in total. The bars will be colored and patterned to indicate if the company has donated to Pride events and/or has an HRC pledge, respectively. This way, we can identify specific companies who have contributed the most to anti-LGBTQ+ politicians to see if they have also supported Pride events. We found this bar plot to be the most appropriate to address our question because it clearly visualizes how much the top 20 companies contributed to campaigns based on if they donated to Pride events or have signed the HRC pledge. Being able to look at specific companies also allows us to conduct further research on outlying companies to see if there is a reason why they contribute so much to anti-LGBTQ+ campaigns.
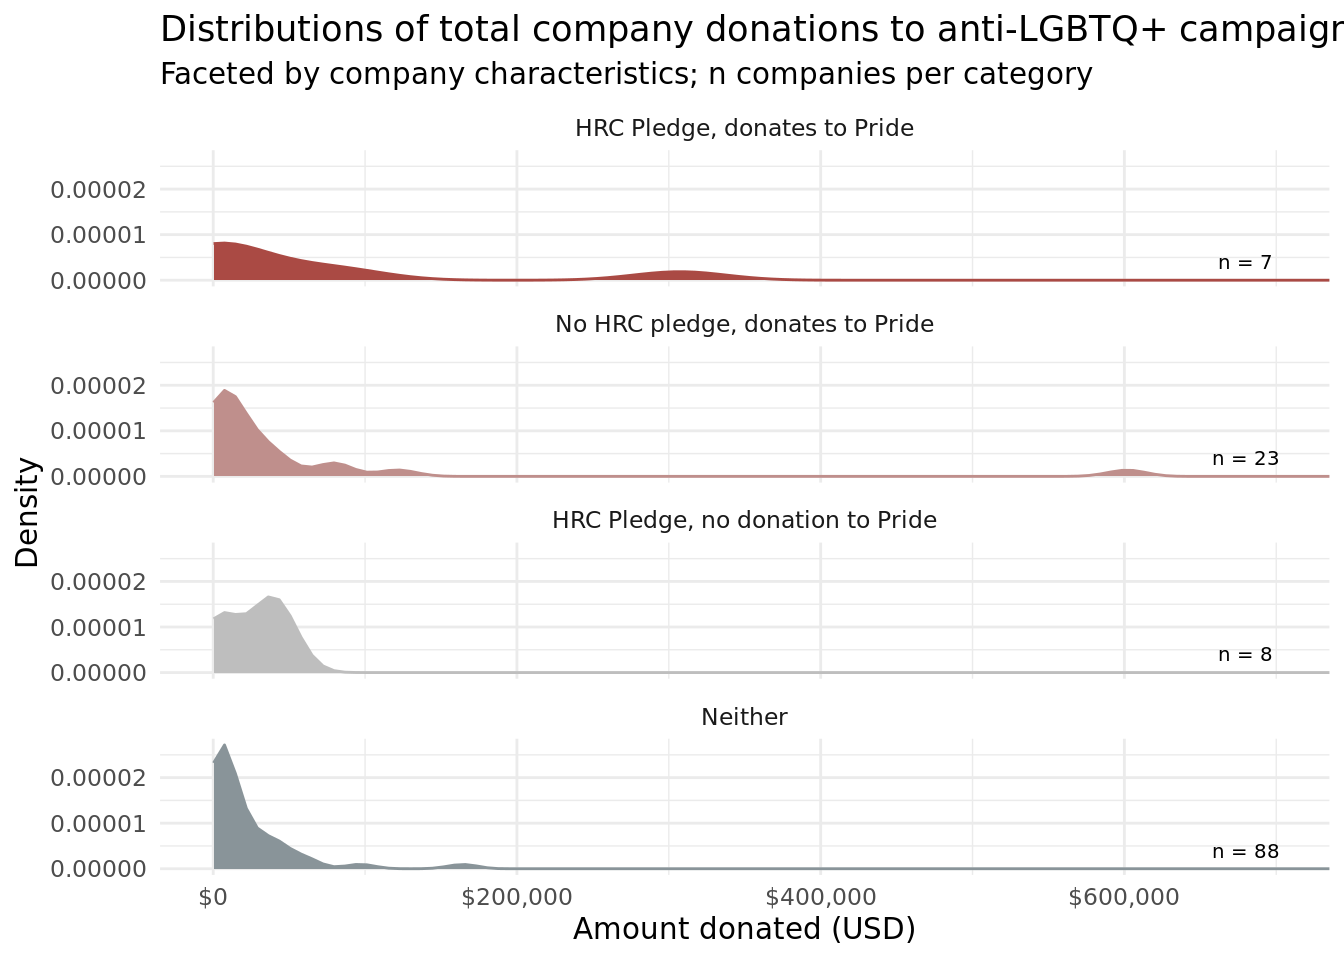
For our second plot, the density plot, we decided to group companies into four categories: 1) HRC pledge and donates to Pride; 2) HRC pledge and doesn’t donate to Pride; 3) No HRC pledge and donates to Pride; and 4) Neither HRC pledge nor donation to Pride. For each of these categories, we wanted to look at the distribution of amounts contributed towards anti-LGBTQ+ campaigns. We also included annotations for the number of companies that fall into each category to provide helpful context for analysis. Finally, we decided to use a density plot because it best captures the shape of the distribution and helps us identify the skew and number of peaks as well as the frequency of contribution amounts.
Analysis
Plot 1:
Plot 2:
Discussion
Looking at the density plot, we can see that the distributions for all four company categories are right-skewed and roughly unimodal. In general, a large proportion of the donations across all categories are between 0 and $200,000. For the HRC pledge and donates to Pride catagory, we can see that the distribution is relatively loosely clustered compared to those of the other categories, and there’s a wider range of donation amounts. The category of neither (no HRC pledge and doesn’t donate to Pride) has the tightest distribution of all of the categories. This suggests that companies, who are in general supportive of anti-LGBTQ+ beliefs, are donating many smaller amounts towards anti-LGBTQ+ campaigns as opposed to large one-time contributions. However, when interpreting our visualization, we also have to keep in mind that the number of companies that fall under each category is different, thus we included the number of companies as annotations.
In the second plot, looking at the top 20 companies in contributions that contributed to anti-LGBTQ+ campaigns, we found that the majority of the companies do not donate to Pride (12 out of 20). We can see that more companies also do not have an HRC pledge (16 out of 20). One company doesn’t donate to Pride but has a HRC business pledge and three companies donate to Pride and have an HRC pledge. As such, it seems that slightly more than half of the high-contributing companies that support anti-LGBTQ+ campaigns are not hypocritical and do not support both LGBTQ+ movements and also anti-LGBTQ+ politicians at the same time. On the flip side, this also means that almost half of these big companies are hypocritical and may be publicly supporting LGBTQ+ people on the surface but secretly supporting anti-LGBTQ+ political campaigns. This can suggest that many companies who support anti-LGBTQ+ political campaigns try to do so without drawing attention to themselves and are likely to also donate to Pride events to look good to the public and avoid backlash. It would be interesting to compare the amounts these hypocritical companies donate to Pride versus anti-LGBTQ+ politicians to see if they only donate small amounts to Pride events to appease the public.
Looking at the amount of total contributions, most of the top 20 companies have total contributions under $100,000, with the exception of large outliers such as Toyota and AT&T. Both Toyota and AT&T donate to Pride events and AT&T has even signed the HRC pledge. Both of these companies are also large companies that many people across America can easily recognize. However, Toyota is a Japanese owned company, and Japan as a whole is a relatively more conservative country who has not experienced nation-wide LGBTQ+ right movements like the U.S. has. So, it is not very surprising that Toyota as a company does not support Pride and instead supports anti-LGBTQ+ campaigns. Being a foreign-owned company with much of its business in America, it is also not surprising that Toyota contributes a lot of money to U.S. political campaigns, perhaps in an attempt to improve their business prospects. AT&T, however, is an American-based company, but they have been known to be anti-LGBTQ+ and many new articles (NYT) have criticized the company for their anti-LGBTQ+ sentiments. Thus, it is also no surprise that AT&T donated a lot to anti-LGBTQ+ campaigns, but perhaps they also donated to Pride and signed the HRC Pledge to cover or make up for their unpopular beliefs and to appease the general public and journalists.
Question 2: How have donations to politicians who support anti-LGBTQ+ campaigns changed over time?
Introduction
We are very curious about how the total amount of money contributed to anti-LGBTQ+ politicians has changed over the years, especially given the growing discussions around human and LGBTQ+ rights. We also know that outspoken homophobia and transphobia have also increased during and following Trump’s presidency, so it will interesting to see how these two opposing trends have affected the amount of contributions to anti-LGBTQ+ political campaigns in the past few years.
In particular, Greg Abbott, the current Governor of Texas, has been receiving a lot of public attention recently as an outspoken Republican for his anti-LGBTQ+ beliefs. For example, on February 13, 2023, an article by the Human Rights Campaign denounced Abbott for claiming that he will aim to ban transgender college athletes from playing any sports that are consistent with their gender identity. According to Time, in 2022, he also had an Anti-Trans Directive which negatively affected youth from the LGBTQ+ community; he said that the provision of gender-affirming care for children was a form a child abuse, and many families were investigated for this. From our EDA, we also realized that Abbott received the highest number of individual donations overall, despite him only being included over the years 2019-2022. As an extension of our main question, we are interested in looking into donations that were made specifically to Greg Abbott and seeing how his amounts compare to overall trends across all politicians in the dataset. Overall, we would hypothesize that the trend of anti-LGBTQ+ political campaign donations would decrease over time (or we would hope they do), however, due to the large media presence of Greg Abbott and his strong rhetoric on this topic, we believe he might prove a contrast to the overall trend.
Approach
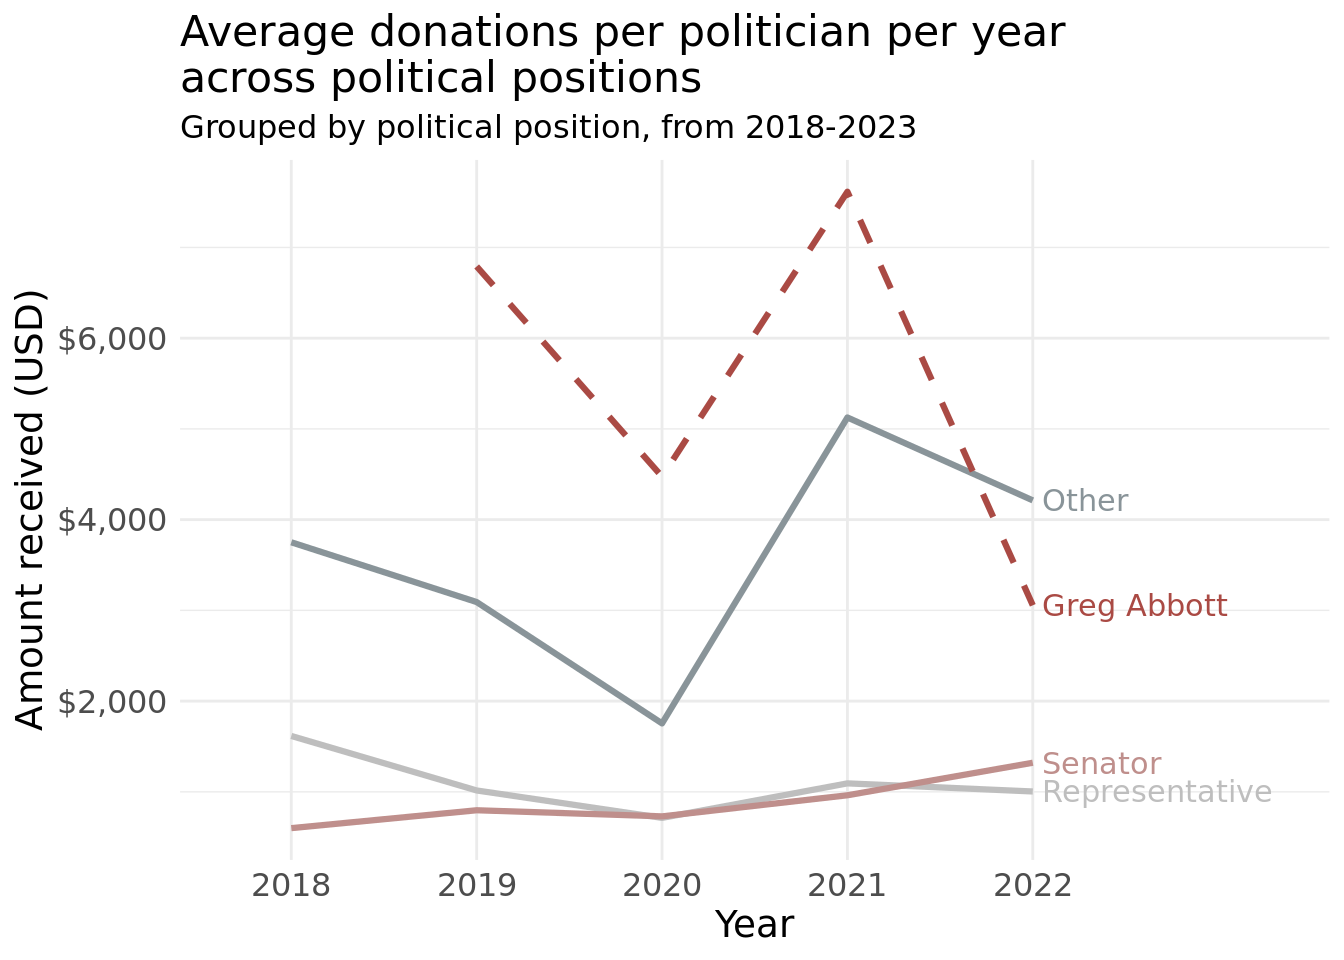
Our initial instinct, when curious about change over time for companies’ donations to anti-LGBTQ+ politicians, is to create a line plot because these naturally highlight trends over time. Although we hypothesized a decrease in total donation amount over time, we want to acknowledge that different trends may exist for donations to politicians at different positions and levels of power. Directly comparing total donations to different political positions would not be very beneficial, however, because of different numbers of politicians in various roles within our data. Instead, we thought to calculate each politician’s average amount received per year, then average these by position per year to increase comparability between positions. We incorporated three groups, Senators, Representatives, and Other, which includes more specific leadership roles where only one person holds that title per state such as state Speaker of the House and Caucus Chairman, in order to reduce the number of lines on our plot and also increase the consistency of averages that may not have had many politicians to consider. We also reduced the range of years to focus on more recent election cycles due to the inclusion of more politicians in our data during the years 2018-2023. In order to consider Greg Abbott’s individual trends and fluctuations we separated his data from the others and ploted his yearly averages as a separate line. Using average donation amount received by individual politicians per year, averaged by position, has the added benefit of allowing us to compare between the lines averaging between many politicians and Greg Abbott on his own.
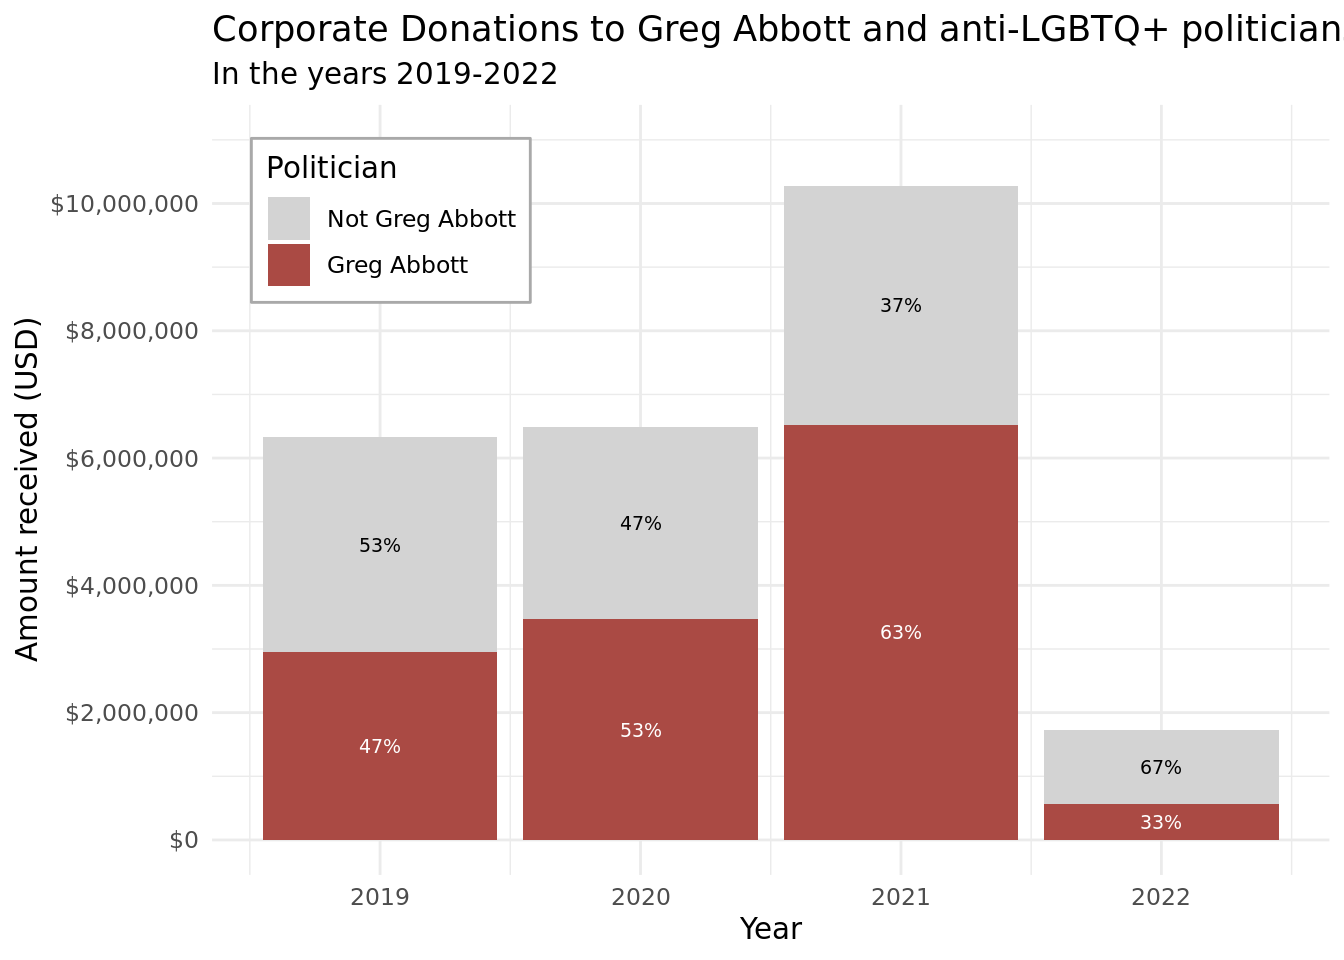
We are also interested in examining how the total amount contributed to anti-LGBTQ+ politicians by companies has changed over time. To do this, we created a stacked bar plot with year on the x-axis and total amount of contributions on the y-axis. The height of each bar indicates that year’s total money received by anti-LGBTQ+ politicians across the six states included. Diving further, we wanted to also look at Greg Abbott and how donations to him compares to the overall amount. For the stacked bar plot, we colored by Greg Abbott vs. all other politicians except Abbott. Since Abbott only had data for the years 2019-2022, we focused on those four years in our plot.
We understand that a challenge with stacked bar plots is trying to compare them when their heights are different. So, we added annotations for the different proportions (in %) to make the stacked bar plots easier to interpret and to make it more clear how the contributions to Abbott compared to those of the other politicians. We found the stacked bar plot to be the most appropriate for this question because it shows how the total donation amounts were divided between politicians who were and were not Greg Abbott. It also clearly visualizes the relationship of each group of politician on the overall donation amount. Overall, the plot we created was helpful in comparing the total donation amounts for politicians who were and were not Greg Abbott simultaneously and understand the different proportions in donations over the years.
Analysis
Plot 3:
Plot 4:
Discussion
From the line plot, we can see that the average contribution amounts towards state Senators and Representatives are fairly similar to each other from 2018 to 2022. However, the average amount per contribution is much higher for politicians in the “other” category, which includes politicians in more distinguished leadership positions such as Speaker of the House and Caucus Chairman. The average contribution amounts towards Greg Abbott, with the exception of year 2022, is greater than the average contribution amounts towards politicians in higher leadership positions. This suggests that, on average, anti-LGBTQ+ state Senators and Representatives receive less donations than anti-LGBTQ+ politicians in higher leadership positions who also receive less donations than Greg Abbott. These findings are not surprising since many companies would want to donate to politicians who hold more political power, such as those with higher leadership positions in state legislatures and Greg Abbott who is the Governor of Texas and a very outspoken Republican.
Looking at how average contribution amounts to anti-LGBTQ+ politicians have changed over time, we can see that average contribution amounts had been slightly decreasing across all politician groups from 2018 to 2020 before suddenly skyrocketing from 2020 to 2021 and then decreasing again from 2021 to 2022. For more context, there was a presidential election in 2020 where Trump ran for re-office against the now Democrat President Biden. With this historical context, the trends in our plot of average contribution amount over time makes more sense. Before the 2020 presidential election, contributions to anti-LGBTQ+ politicians may have been declining because of strong support for LGBTQ+ rights and movements. However, in 2021, the contributions to anti-LGBTQ+ politicians may have suddenly increased because companies with anti-LGBTQ+ sentiments may have felt the need to keep more conservative, Republican politicians in power in state legislatures in response to decreasing federal Republican power.
From our fourth plot, we can see that in the years 2019-2021, there has been an increase in the amounts donated to politicians who are anti-LGBTQ+, with a stark increase in the year 2021. Upon further research, we found that 2021 was the worst year for anti-LGBTQ+ legislation since 2015 (HRC). In 2021, there were 17 anti-LGBTQ bills that were enacted into law, and this was more than the number of anti-LGBTQ+ laws in the years 2018-2020 combined. Some of these include bills that ban transgender girls from being involved in sports to the erasure of LGBTQ+ individuals from curriculum in schools to felonies for giving transgender young people healthcare in life-saving situations to licenses to discriminate against those in the LGBTQ+ community. In fact, there were over 250 bills that were introduced in legislatures that year. Fortunately, the total amounts decreased significantly in the year 2022, and we hope this downward trend will continue.
Additionally, we can see that the proportion of total donations going to Greg Abbott increased in the years 2019-2021, with him having over 60% of total donations in 2021; not only have the proportions increased during those years, but the dollar amounts he received also increased. This suggests that there was, unfortunately, a lot of support for Abbott, as he has always been very vocal about being anti-LGBTQ+ and is a prominent figure in the US as the Governor of Texas, a traditionally very red state. Fortunately, he received a smaller proportion of the total donations in 2022 and a smaller dollar amount of donations. This could be associated with the fact that he got the worst press out of all governors in the US regarding LGBTQ+ issues (Houston Chronicle), and this could have caused less people to want to donate to his controversial campaigns.
A limitation of our plot is that it only includes information on six states: Florida, Texas, Idaho, Alabama, Arizona, and Tennessee, and there are many more states that are anti-LGBTQ+ that we weren’t able to capture due to limited data. For instance, according to NBC News, 23 states do not protect citizens from discrimination on the basis of sexual orientation. The six states that were in this dataset were some of the most prominent and alarming anti-LGBTQ+ supporters, however, our research would have been stronger had there been information on more states. For instance, if the dataset included blue states, we could have compared the difference (if any) in support for anti-LGBTQ between Republican and Democratic politicians. Finally, the politicians in this dataset were on the state level, and in the future, it might be worthwhile to consider federal politicians and how donations to politicians of even greater power and influence differ from those of state politicians.
Sources:
https://www.hrc.org/resources/business-statement-on-anti-lgbtq-state-legislation
https://19thnews.org/2022/06/companies-anti-lgbtq-bills-lawmakers/
https://www.hrc.org/press-releases/human-rights-campaign-gov-abbott-continuing-his-crusade-to-harm-transgender-and-non-binary-texans
https://time.com/6150964/greg-abbott-trans-kids-child-abuse/
https://www.hrc.org/press-releases/2021-officially-becomes-worst-year-in-recent-history-for-lgbtq-state-legislative-attacks-as-unprecedented-number-of-states-enact-record-shattering-number-of-anti-lgbtq-measures-into-law
https://www.houstonchronicle.com/politics/texas/article/gov-greg-gbbott-gets-worst-press-on-lgbtq-issues-17184157.php
https://www.nbcnews.com/nbc-out/out-politics-and-policy/less-10-2022s-anti-lgbtq-state-bills-became-law-report-finds-rcna67619
https://meyerweb.com/eric/tools/color-blend/#D3D3D3:AA4A44:1:hex
https://www.nytimes.com/2019/07/02/opinion/lgbt-rights-pride-corporations.html
https://stackoverflow.com/questions/49084904/r-markdown-bullet-list-with-multiple-levels
https://en.wikipedia.org/wiki/LGBT_rights_in_Japan
https://coolbutuseless.github.io/package/ggpattern/
https://statisticsglobe.com/ggpattern-r-package
https://coolbutuseless.github.io/package/ggpattern/articles/pattern-stripe.html#the-fill-aesthetic-as-a-mapped-aesthetic-1