Collegiate Sports Budget Analysis
STA/ISS 313 - Project 1
Abstract
College sports are a big part of American college life, and many college sports teams are followed closely by Americans of all ages. These programs generate significant revenue through ticket sales, merchandise, sponsorships, and media rights, and also come with significant expenditures, such as scholarships, salaries for coaches and staff, facilities, travel, and equipment. However, the amount different colleges spend on and earn from their sports programs is far from equal. In this project, we investigate how the amount earned and spent on college sports varies across different categories, including gender, sport, and public and private universities. We hope this analysis serves to better highlight various trends and disparities in college sports funding, and provide opportunities for further investigation.
Introduction
This data on collegiate sports budgets comes from Equity in Athletics Data Analysis. It has 132327 rows and 28 columns, including numeric and categorical variables. The dataset has information on most colleges in the US, regardless of sports division, and consists of metrics such as revenue and expenditure for each sport at the school from 2015-2019. We chose the dataset because it has a large number of variables that will be interesting to analyze, and because, as college sports fans, we think the topic of collegiate sports budgets is interesting, relevant to us, and worthy of exploration. The variables we are primarily concerned with are exp_men, the school expenditure on men’s sports, rev_men, revenue generated from men’s sports for the school, exp_women, the school expenditure on women’s sports, rev_woman, revenue generated from women’s sports for the school, total_exp_menwomen, the total expenditure on men and women’s teams for a certain sport, year, year of athletics, and sector_name, school type like “Private 4 year” for example.
Question 1: How do spending and revenue, and the relationship between these two variables, differ for men’s and women’s college sports?
Introduction
For this first question, we wanted to investigate how colleges, on aggregate, spend on and earn from men’s and women’s sports, and what differences might exist in this area. In recent years, inequities in both college and professional sports have been a topic of national conversation. Female athletes often are forced to use inferior facilities and have access to worse equipment and fewer perks than male athletes. However, many people argue that this is (at least somewhat) fair, given that men’s sports earn much more (and are more profitable) than women’s sports. We wanted to investigate how extensive this gap in funding is, whether the stories about revenue and profitability hold up to scrutiny.
Approach
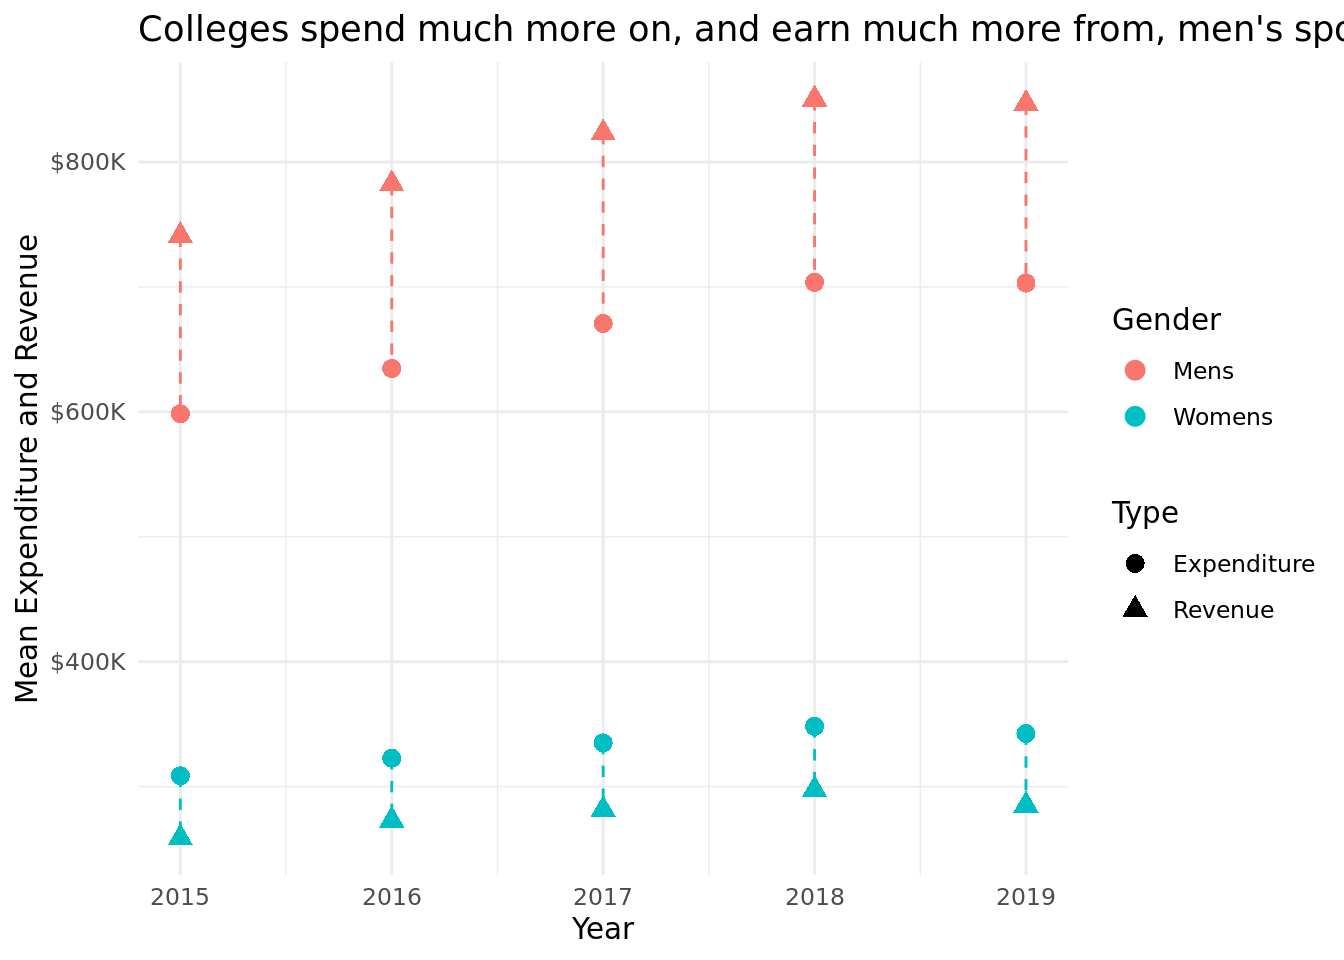
For this first question, we created two plots. The first plot illustrates mean revenue and expenditure for mens and womens sports across all colleges from 2015-2019. We created this graph to provide the best possible big picture overview of the current spending and revenue picture, and also to investigate whether that picture has changed from 2015-2019, a period in which equity in sports was a major focus. We colored the points on the graph by gender to illustrate clearly the differences between mens and women’s sports and used shape to distinguish revenue from spending. We also connected dots for each gender in each year to highlight spending and revenue gaps.
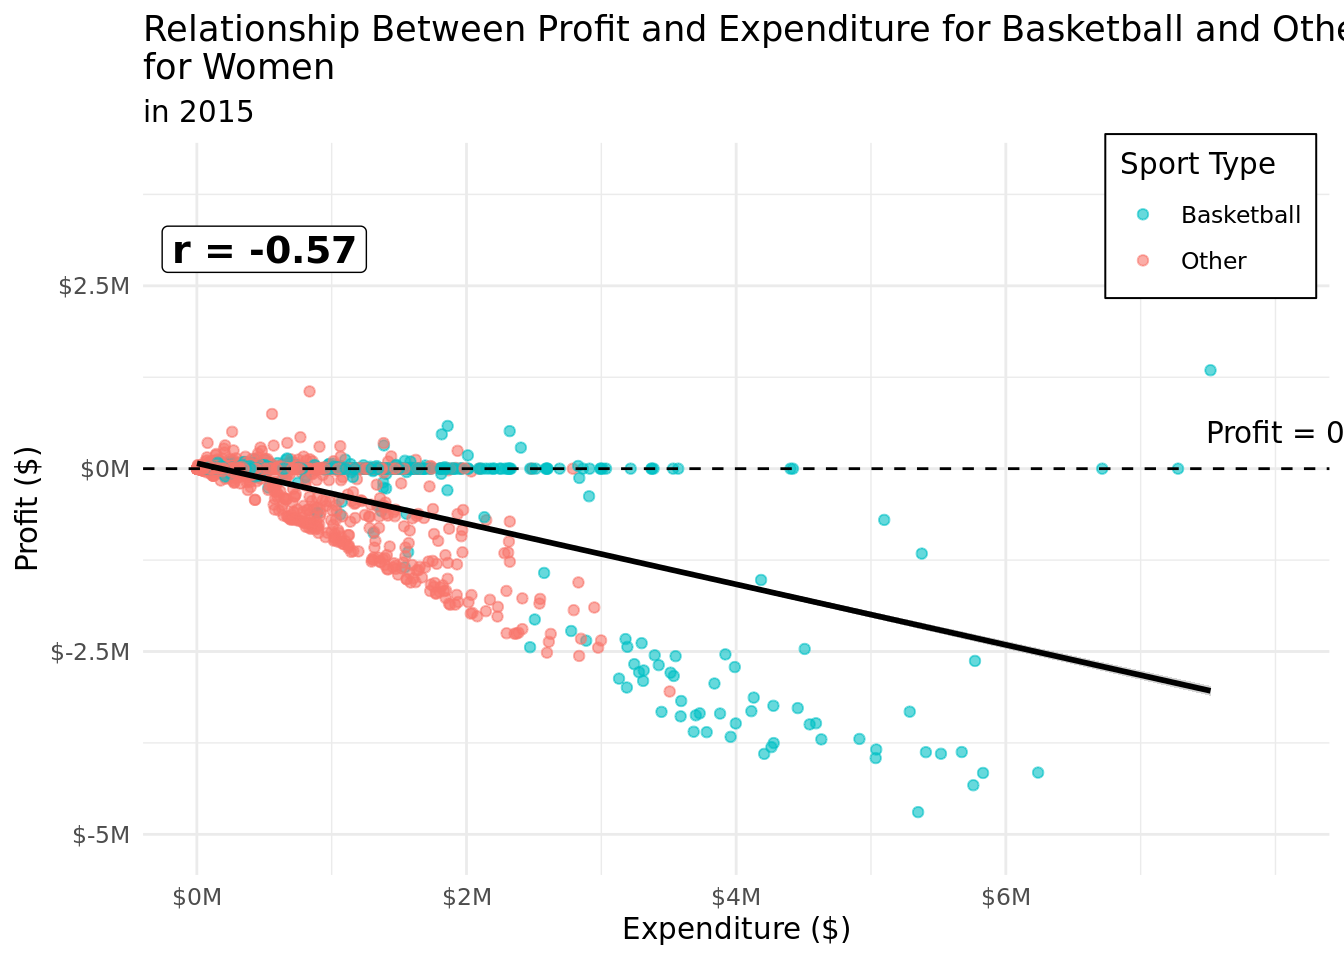
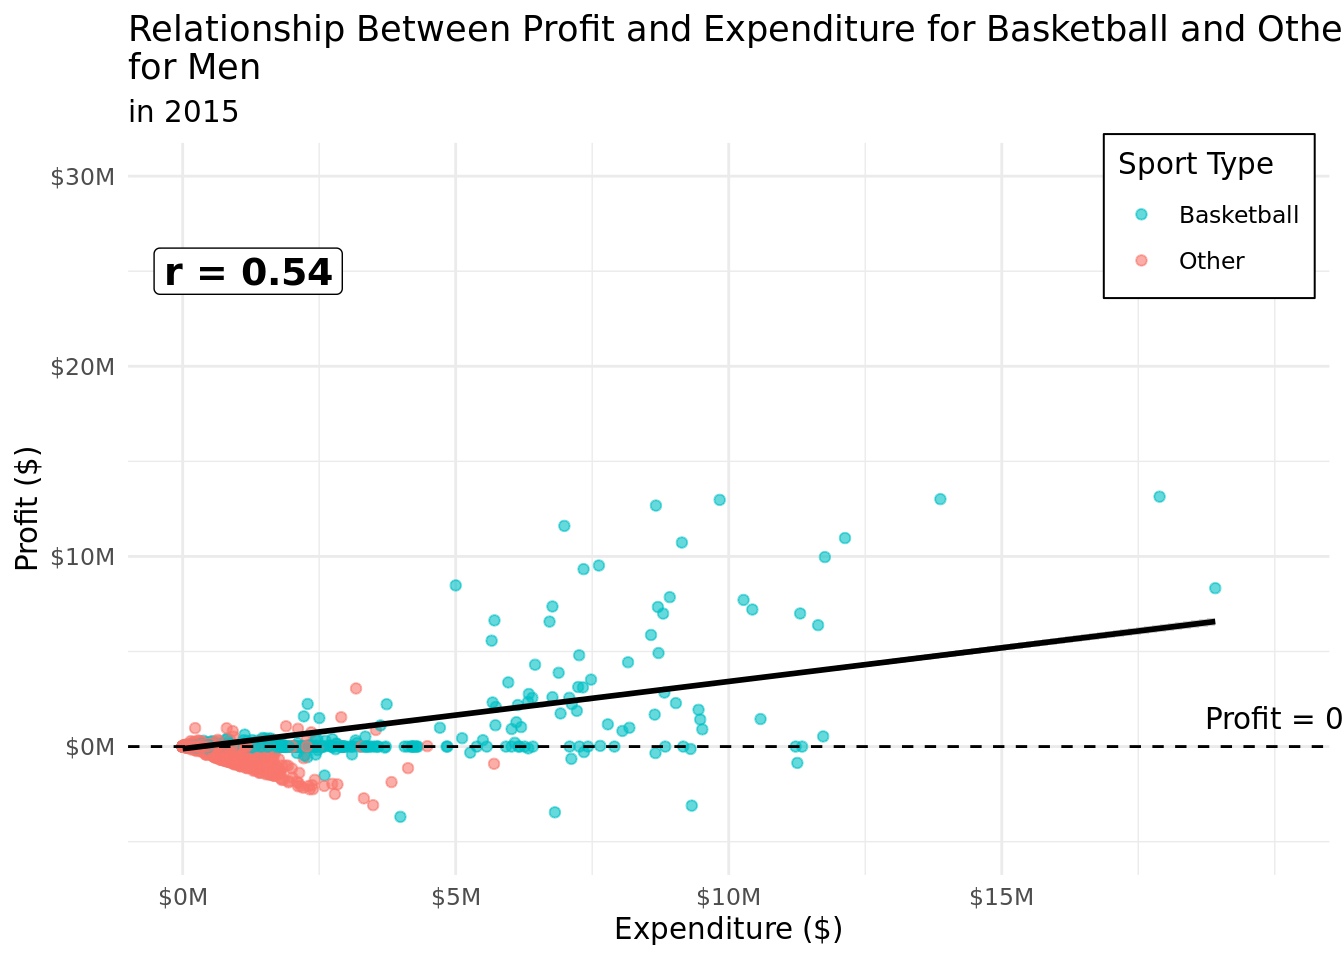
After investigating the differences in revenue and expenditure for men and women in our first plot, we are also interested in investigating and analyzing how the relationship between profit and expenditure differ for men and women and whether the sport is basketball or other. To address this difference in relationship, we plan to create a separate scatter plot for men and women, colored by sports. We decided to use a scatter plot because we want to visualize and analyze the relationship between two quantitative variables. We also plan to add a best trend line through the data points to get a better visualization of the strength of relationship between profit and expenditure. Additionally, to further analyze how the relationship between profit and expenditure differ between men and women, we plan to calculate the correlation coefficient for each gender and compare them to see which correlation coefficient is higher.
Analysis
| Year | Institution | Sport | Profit |
|---|---|---|---|
| 2015 | Stanford University | Basketball | 15496493 |
Discussion
This first chart reveals several key finding about how spending and revenue differ for men’s and women’s college sports. First, men’s sports are, on average both spending and earning far more than women’s sports. This gap was persistent from 2015 to 2019, in fact even slightly growing across this time period. We were surprised to see that the gap was this dramatic, especially given Title IX spending rules; we were also surprised that the gap grew during a time period where so many people have been focused on equity in sports. A second finding evident in this chart is that men’s sports, on average, earn more than they spend, while the opposite is true for women’s sports. This positive gap in earning is also greater in men’s sports than the respective negative gap in earning for women’s, a finding which is also consistent across years.
We can see that the relationship between profit and expenditure differs greatly for men and women. For men, there appears to be a moderate positive relationship between profit and expenditure while for women there appears to be a moderate negative relationship between profit and expenditure. This trend is probably because women collegiate programs obtain less publicity in corporate sponsorship and media viewership and thus less revenue, according to the NPR article on unequal profits. The magnitude of the r-squared value 0.57 for women is slightly greater than 0.54 for men. This means that the relationship for profit and expenditure for women follow more of a linear relationship than for men. The relationship between profit and expenditure for basketball is positive and stronger than the relationship between profit and expenditure for other sports where the relationship is negative because men’s collegiate basketball is one of the most popular collegiate sport that generates enormous amounts of publicity and profit. However, for women, no matter the type of sport, the relationship between profit and expenditure is negative and similar. This similarity in trend for all sports for women shows that there might be some underlying gender discrimination and under-representation in terms of profitable opportunities in collegiate sports for women.
Question 2: Differences in sports expenditure between public and private universities
Introduction
We are interested in seeing how the mean expenditure per sport of Division I-FBS schools from 2015-19 differs for public and private universities. The Division I-FBS is the top division in college sports that at the time of our data being collected, consisted of 126 universities, 18 private and 108 public. The parts of our data that are necessary to answer this question are the sport, whether or not a Division I-FBS school is public or private, and difference in the mean expenditure for public and private schools over the years for each respective sport.
This question intrigues us question as in general, private schools have a frequently have larger endowments than public schools, meaning they have more money to spend on athletics. On the other hand, public schools are larger, have a larger fan base, consistently outperform private schools in football, and receive state subsidized funding allowing them to possibly spend more on sports. With both schools having a possible advantage in expenditure spending, we are interested to see which schools spend more money on their athletics programs.
Approach
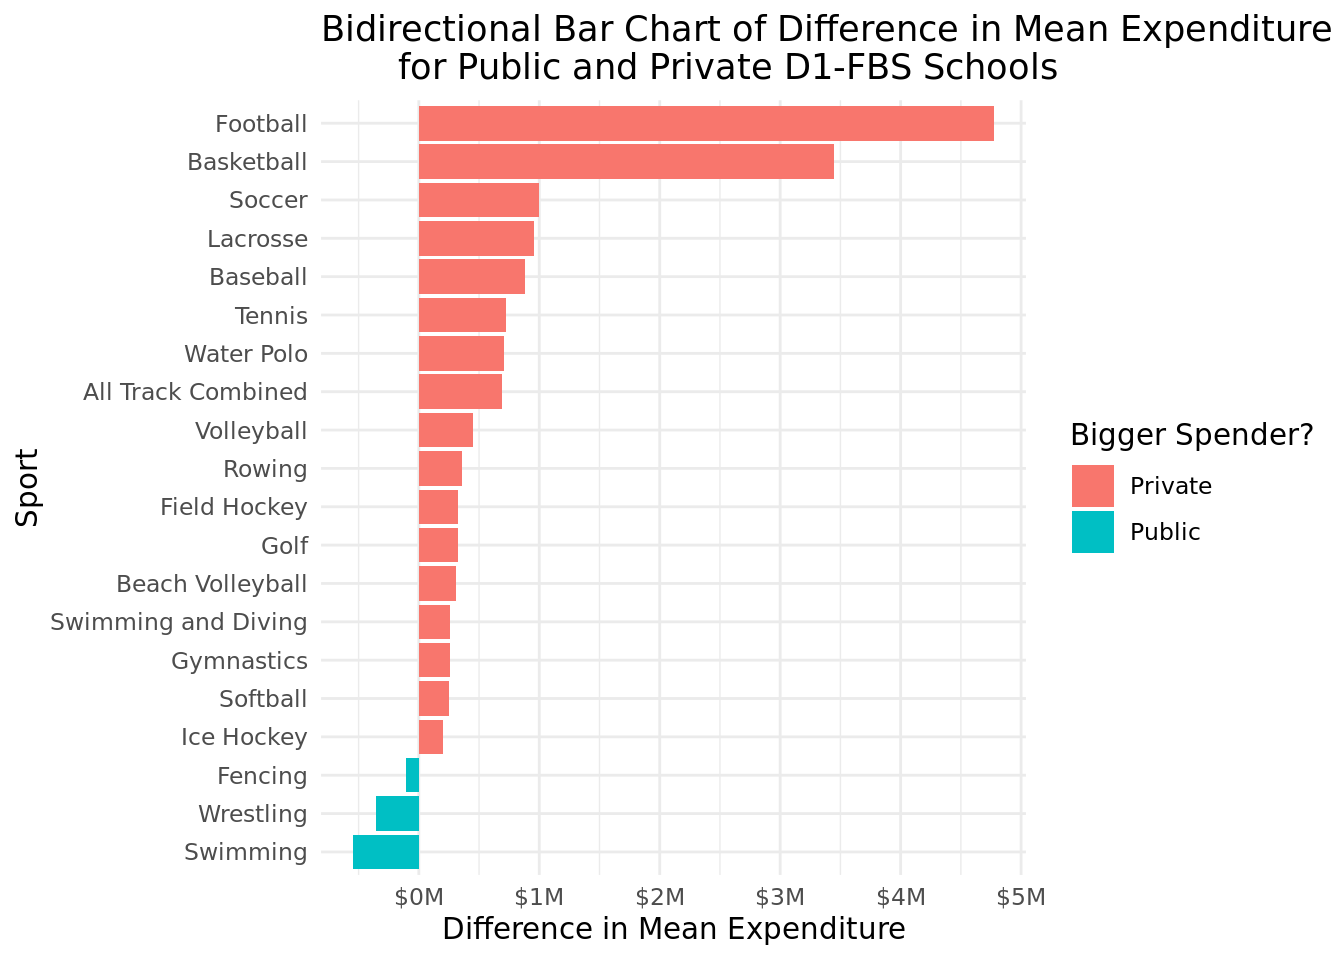
The first plot we are going to make to answer this question is a bidirectional bar chart plotting the difference in mean expenditure for public and private schools for for each respective sport. We plan to have sport on the y-axis and the difference in expenditure on the x-axis. A bidirectional bar chart is the best chart to show the difference in mean expenditure per sport as it will clearly show which sports private schools spend more money on and which sports public schools spend more money on. It will clearly show this relationship as the bars will point in opposite directions depending on whether private or public schools spend more. Furthermore, this chart will also show how much the mean expenditure is different between the private and public schools for each sport, giving us a good indication on whether or not there are simply minor or major spending differences. This chart will also allow us to see the general trend in spending differences and the range that spending differences genrally fall between.
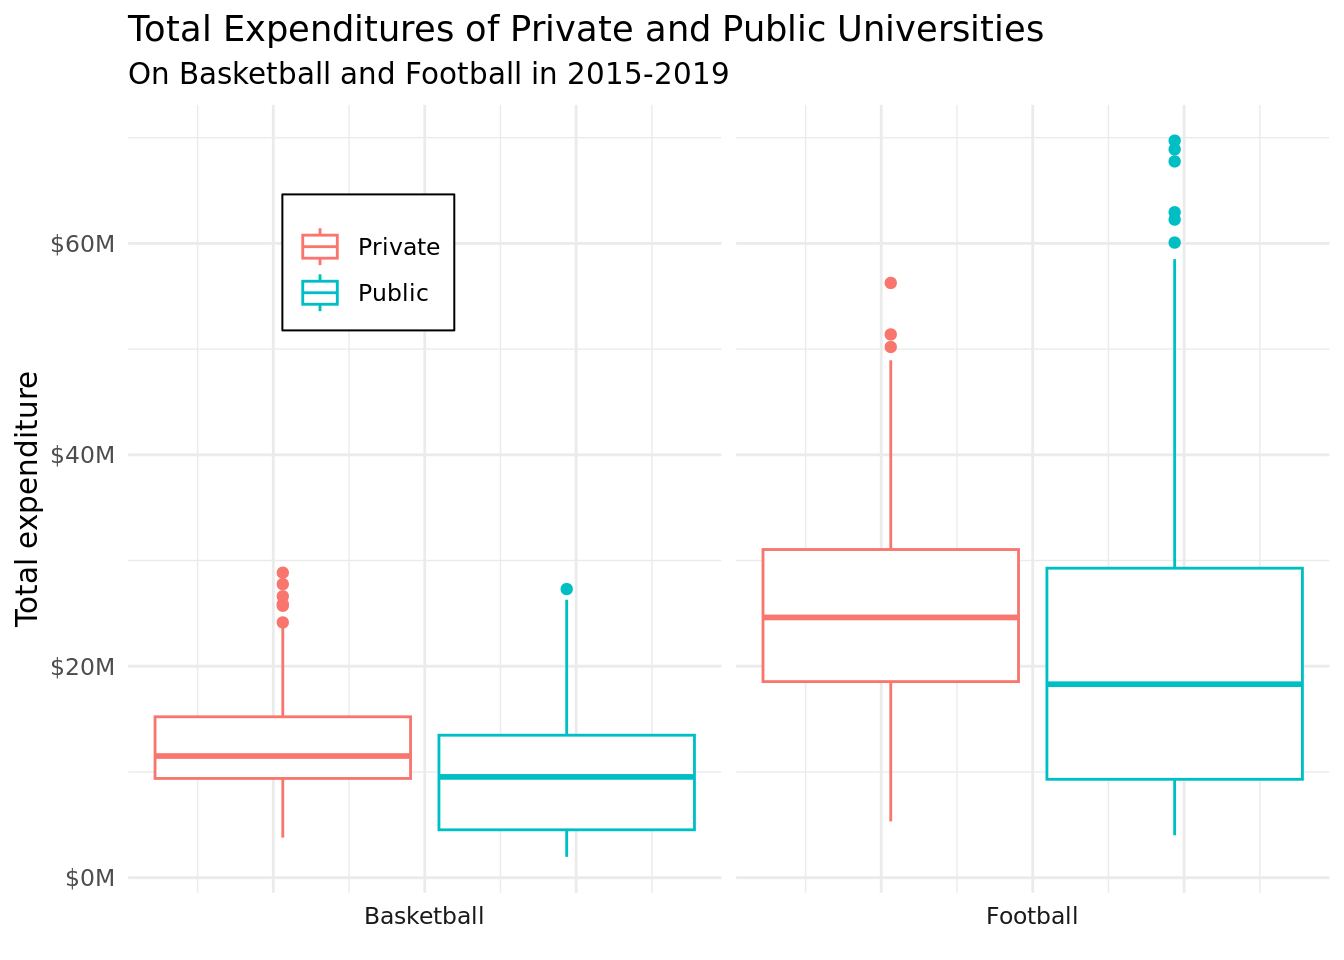
Public universities tend to outperform private universities in football games. Nevertheless, based on the initial visualization, it was discovered that private universities allocate more funds for this sport than their public counterparts. Consequently, we conducted further analysis on the data distribution of the two major university sports, namely basketball and football. These sports were chosen due to their large number of data points. To display the distributions, we employed box plots that were facet-wrapped by sports and color-coded according to the type of university, whether public or private.
Analysis
Discussion
Private schools outspent public schools on every sport except for swimming, fencing, and wrestling, only by around $500,000 or less. The biggest surprise to us was that the private schools spend around $4.75 million more than public universities on their football programs. A private school has not won the college football national championship in 20 years, so it is very surprising that over the years from 2015-19 the mean football expenditure across private schools was $4.75 million more than that of public schools. Other than Football and Basketball, the general trend in the data is that the mean expenditure of private and public universities is within $1 million of each other. The data probably looks the way it does as since private schools are generally not as good as public schools at football, they spend more money on their programs for things like recruiting and facilities in order to entice recruits to come without the storied success schools like Alabama have. Private schools may spend more money on basketball simply due to the fact that public schools are more concerned with their football programs and do not care to spend as much money on basketball. When dealing with budgets that are in the multi million dollar range, a couple hundred thousand dollars is not that large of a number in the bigger picture, that is probably why most of the sports difference in mean expenditure falls between $1 million.
The second visualization indicates that private universities spend more on football than public universities, with a noticeable difference in median expenditure. This implies that half of all public universities allocate less funding to football compared to half of all private universities. However, there are multiple exceptions within the public universities, as some spend more than private universities, which may be attributed to their success in football. Despite the significant difference in the first plot, we found out from this visualization that there are some public universities that spend more on football than private ones. On the other hand, for basketball, there is no significant difference in median expenditure between public and private universities. Nonetheless, public universities have a bit wider range of expenditure on basketball than private universities. Overall, universities tend to allocate more funding to football than basketball.