The Evolution of the World Cup
STA/ISS 313 - Project 1
Abstract
For our project, we are exploring goal scoring trends and representation of teams from non-European countries in the FIFA World Cup. We analyzed how the introduction of penalties, the expansion of team size, goal line technology, and VAR in the World Cup have impacted the goals scored per game over time. Our results showcased that penalties and the expansion of team size did not have a major impact on goal scoring, but goal line technology and VAR both have increased the number of goals scored per game. Since the addition of technology like VAR and goal-like technology, the frequency of penalties and the proportion of goals that are penalties have increased. In addition, we analyzed how the proportion of WC teams by continent changed over each year of the World Cup. Our results showcased that although Europe has been the most represented continent in the World Cup, its representation has decreased over the years as more teams from Asia/Oceania and Africa have increased. We also explored how the representation of non-European and South American teams changed across the rounds of the World Cup. In our results, we observed that although there is an increase in representation from non-European and South American teams in the earlier rounds over time, this diversity of continents is not represented in later rounds where European and South American teams typically dominate.
Introduction
The datasets we used for this project revolve around the Fifa World Cup, a quadannual torunament where the top football countries battle it out for glory on the pitch. The first dataset, wcmatches contains every football match played in the world cup from its inception in 1938, to the 2018 world cup in Russia. Columns inside the dataset include the city the match was played in, the teams playing, the outcome, goals scored by each team, stage of the cup and more. The second dataset, worldcups contains summary information on each world cup. This information includes the winners (along with second through 4th place), where the cup was held, the total goals scored, number of games and other similar information. We also use an external dataset from kaggle called penalties which gives us the data on penalty kicks from each world cup. The dataset has a year column and then penalty related columns like, total penalties called, penalties missed, penalties saved, and more. All three datasets are very easy to merge based on the year variable.
Question 1: The Effect of New Rules on Goals Scored
Introduction
Throughout the World Cup’s history, many new rules and technologies have been implemented, changing the way soccer is played. This includes the introduction of penalties for tie breaking, VAR to contest calls on the field, increasing the number of teams in each World Cup, and many more. These factors affect how teams play and have forced players to adapt their strategies. In order to assess the impact caused to the overall game, the most straightforward metric to consider is the number of goals scored. Although the score can oversimplify a very complex game, many important decisions are made from it, including which countries make it into the World Cup and ultimately win the tournament. We, as soccer fans, have decided to analyze goals because it is unarguably the most important and entertaining part of the game.
To explore our question, we will be using the wcmatches and worldcups datasets from TidyTuesday, and merging in external data from Kaggle containing specifics into penalty kicks taken during the World Cups. Specifically, we will be looking at the variables with year, goals per game, penalties awarded and penalties per game, as well as created variables indicating the implementation of a new rule or a notable event. We will be analyzing both the broad concept of total goals scored as well as penalty kicks. Penalties are a very controversial and powerful part of soccer. For perspective, 3 World Cup finals have been decided by penalty shootouts. To see how the game has been affected since the introduction of penalties in 1970, we will be analyzing the number of penalties awarded over time, specifically focusing on the differences before and after the implementation of VAR technology. This, in conjunction with the rules implemented, will give us insight into how penalties have affected scores and how players have adapted to the changing rules.
Approach
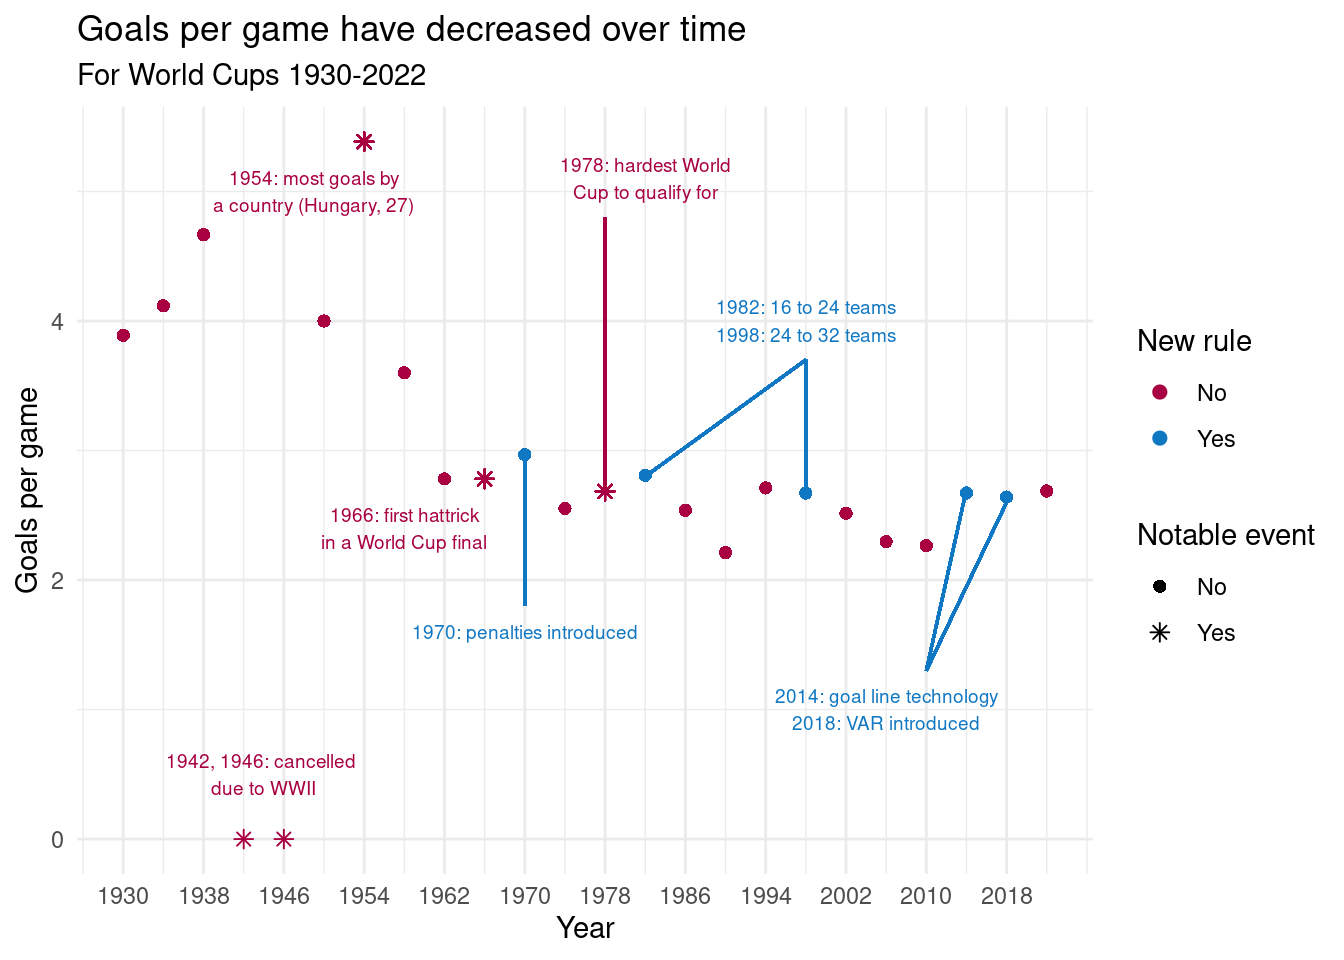
For the first plot, we will be making a scatterplot showing the goals scored per game during each World Cup. This will make the goal scoring trends over time visible and allow for our annotations to reveal possible causes in patterns. We will be coloring points based on whether that tournament had a new rule, and the shape of the point will indicate whether a notable event took place during that tournament. We will add text annotations over the plot indicating what the rule or event that happened during a tournament was.
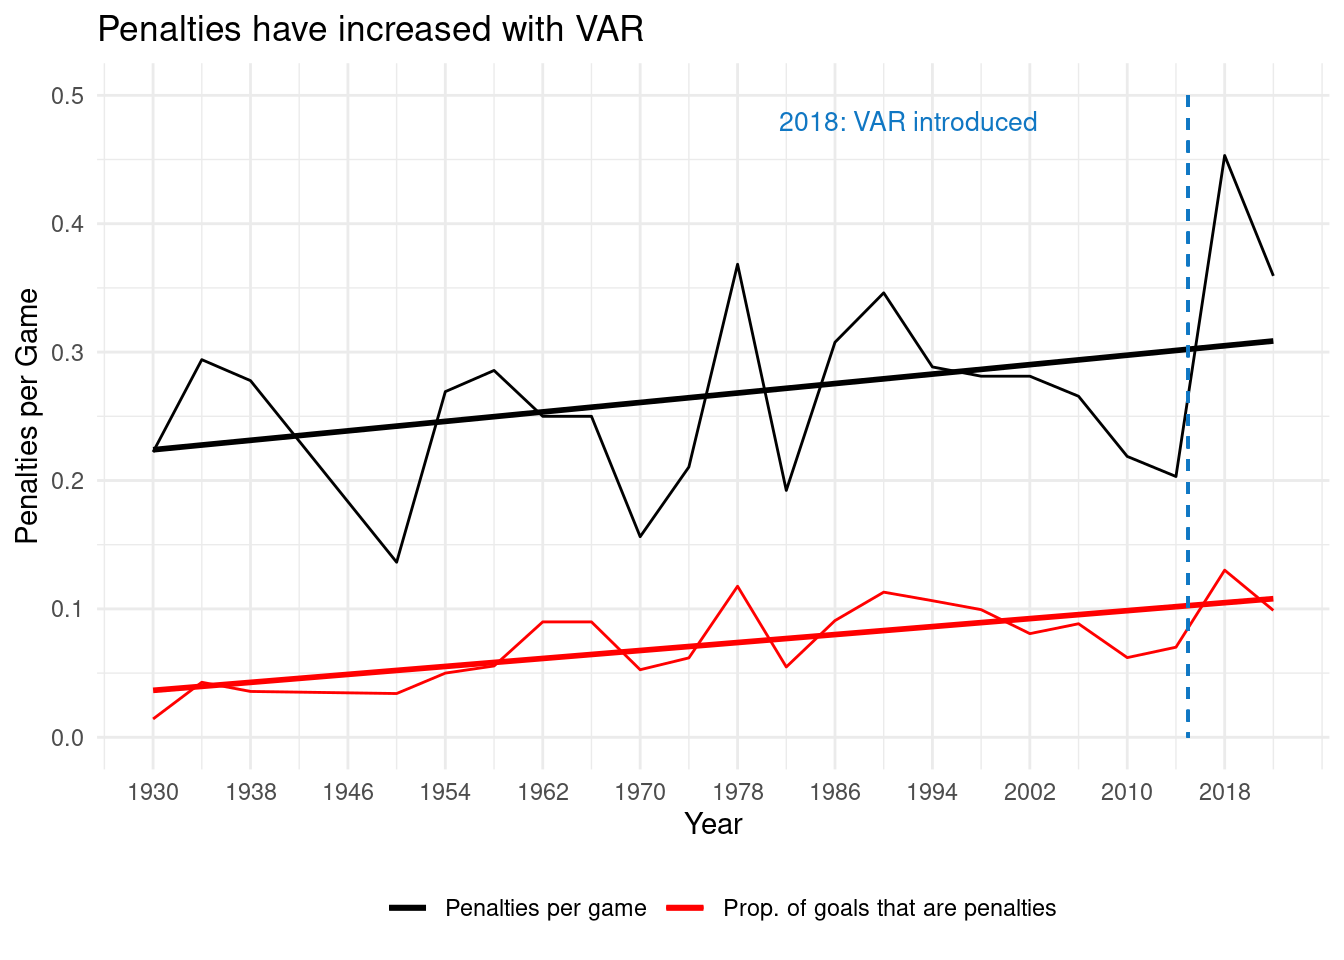
For the second plot, we will make a line graph showing trends of penalty kicks over time. We will be examining penalties per game and the proportion of goals that are penalties, as both metrics are within similar ranges. The line graph will show us how these metrics have changed from tournament to tournament. We will annotate over the graph indicating when VAR was introduced, hopefully to point out the dramatic shift in penalties.
Analysis
Plot 1
Plot 2
Discussion
The overall trend in Figure 1 is the decrease in goals scored per game across the World Cups. After a short 3 tournament long increase, the number of goals scored per game has steadily decreased from about 4 goals to just over 2. The noticeable outliers are 1942 and 1946, which were cancelled due to WWII, and 1954, which was dominated by the Uruguay team who set the record for the most goals scored by one country. The introduction of penalties did not appear to affect goal scoring. The expansion of the tournament from 16 to 24 to 32 teams also did not have a lasting impact other than the 2-tournament downward trend following 1982. It seems that the implementation of technology in arbitrating games has produced the largest effect in decades. The notable spike in 2014 and following years shows an increase in the number of goals scored per game. Goal line technology, which notifies the referee when the entire ball crosses the goal line, and VAR (video assistant referee) which allows referees to rewatch plays and either uphold or reverse their initial calls on the field, have both increased the number of goals being scored per game. This is because goal line technology allows referees to stop play the moment a true goal is scored, despite limited vision, and VAR has caused more penalty kicks to be called, which frequently result in goals.
In Figure 2, there is an overall increase both in penalties per game and the proportion of goals that are penalties. The plot starts in 1970, when penalties were introduced to the World Cup. The penalties per game seems to change fairly dramatically across World Cups, but following the introduction of VAR, there is an unparalleled spike in the number of penalties per game during the 2018 World Cup. Referees were now able to rewatch plays and determine whether fouls had been committed to award these penalties, causing a huge uproar. The FIFA referees have tried reducing their dependency on VAR, as seen in the downward trend in the 2022 World Cup, but penalties still remain much more prevalent than they were in past World Cups. The proportion of goals that are penalties also experienced a jump in 2018 with a decrease in 2022. Since this data does not include penalty shootouts, we are only counting penalties taken during the game. It is clear that penalties are becoming more important, and we should expect to see more games decided by them.
Question 2: Representation of Non-European and South American Teams in the World Cup
Introduction
Ever since the beginning of the World Cup, the game has been dominated by European and South American teams with little representation and participation of teams from Africa, Asia, Oceania, and North America. Despite its ‘world’ name and global scale of the game, the World Cup lacks representation from Non-European. Especially with the recent World Cup in Qatar where Morocco successfully made it to the Semifinals, as fans of the World Cup, we are interested in exploring the representation of Non-European in the World Cup and how it changes across rounds and over time.
To explore our question, we will use the wcmatches and worldcups datasets from TidyTuesday and merge them by the year of the world cup in order to bring over the information for each world cup to each world cup match. To measure representation from Non-European and South American Teams, we created a variable continent based off of the countries of the teams with the levels Africa, Asia, Europe, North America, South America, and Other. We will use continent to explore how the representation from the different continents changed over the years of the World Cup by observing how the proportions of teams from different continents change over time. To observe if an increase in representation in earlier rounds will also reflect in the later rounds with an increase in representation from non-European and South American teams, we will look at representation across the different rounds in the World Cup since the World Cup is an elimination game.
Approach
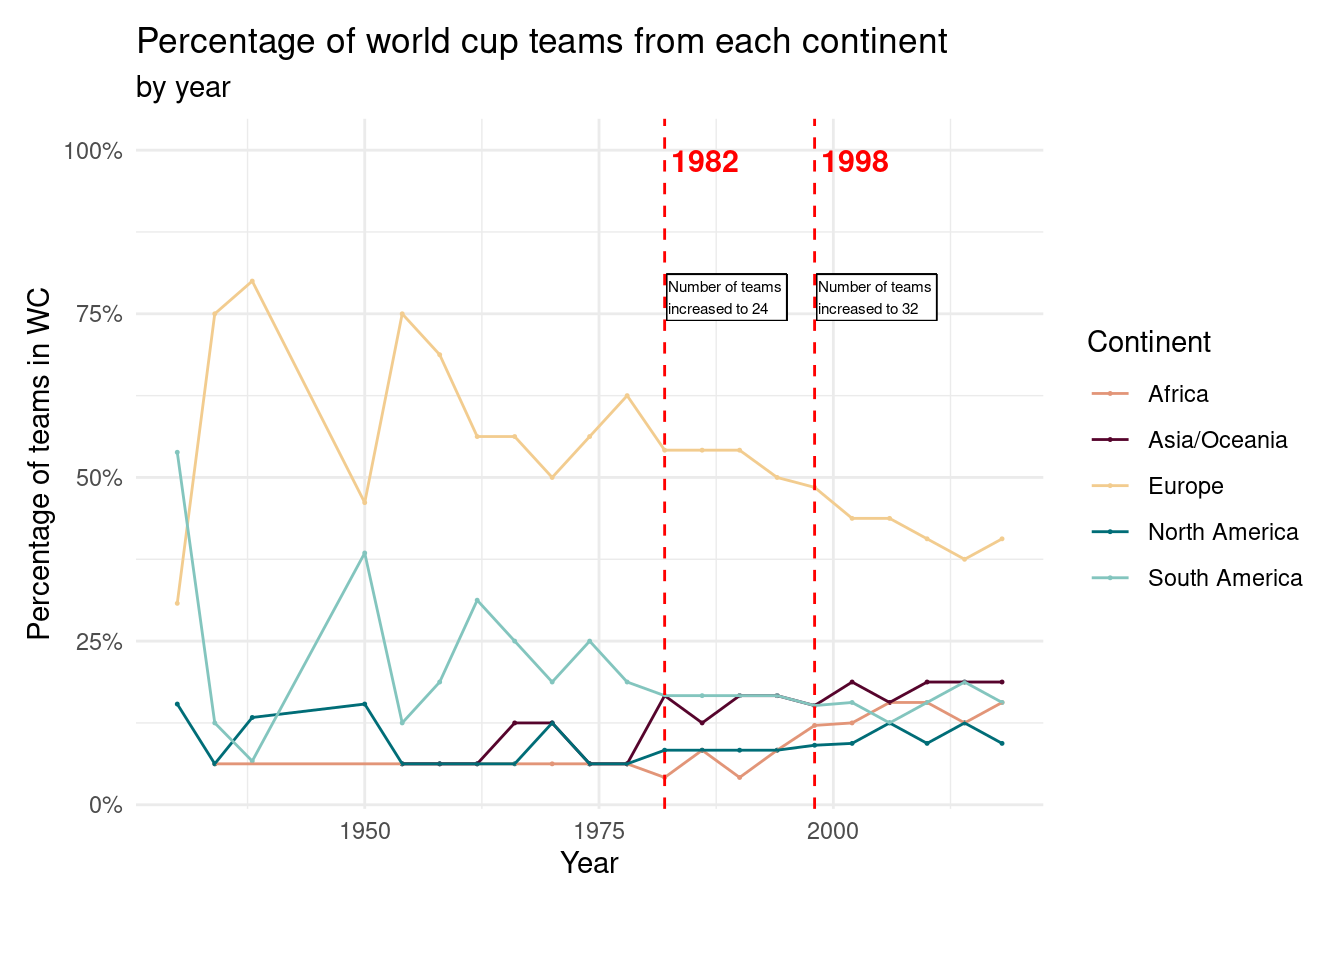
For our first plot, we made a line graph which records the proportion of WC teams by continent over the years. So the x-axis is the year variable and the y-axis is a newly created variable which the proportion teams from a specific continent represented in that world cup (so for each year, all the proportions will add up to 100%). The graph will be colored by continent to differentiate each line. We felt that a line chart segmented by color was best as line graphs are very useful for time series data. Furthermore, having all the lines on the same graph will be great for comparing the increases/decreases in representation of different continents over time.
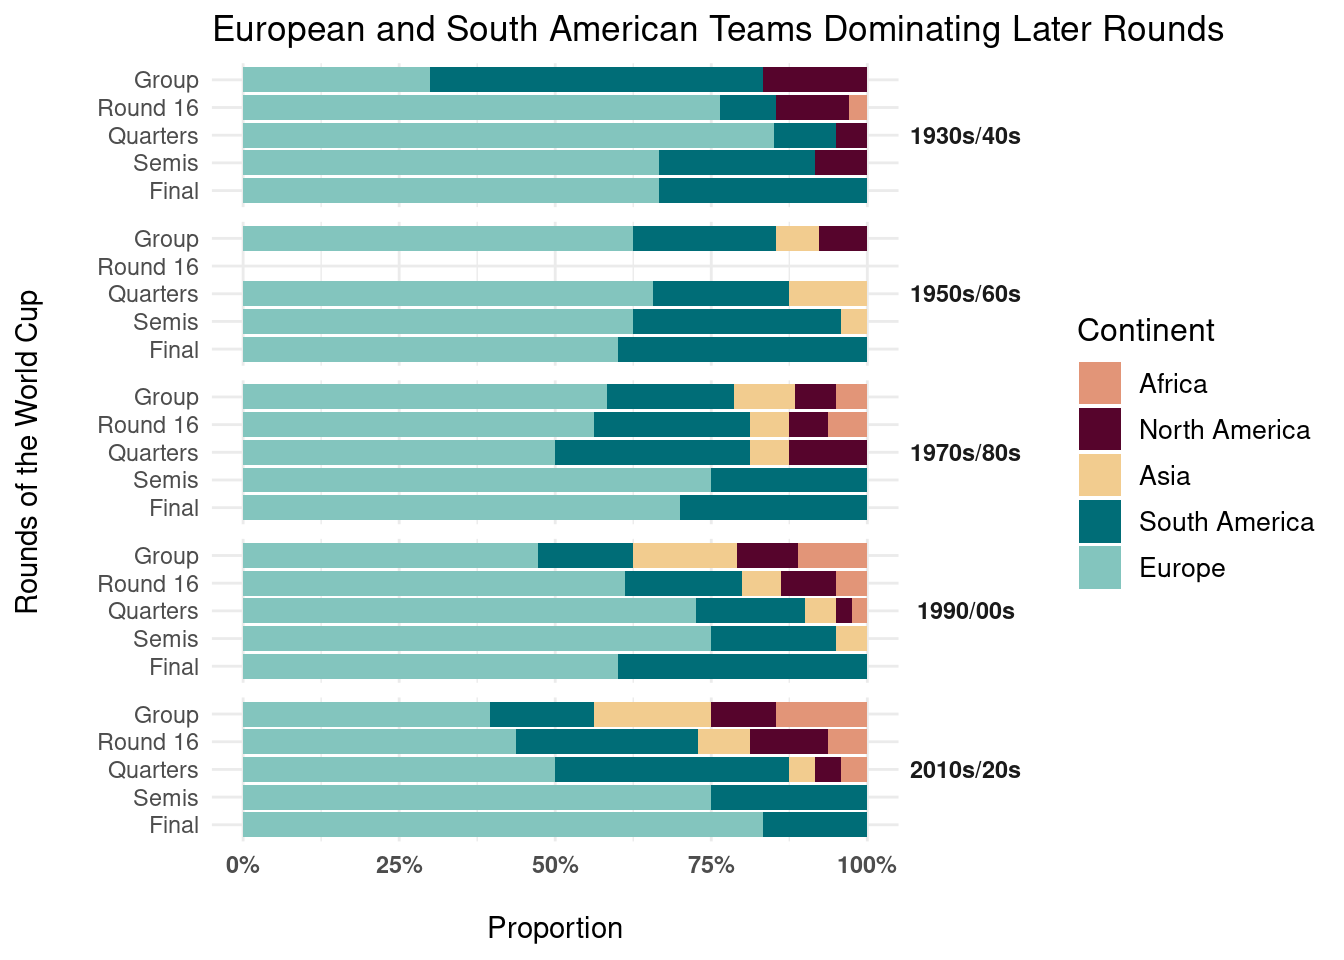
For our second plot, we will make a segmented relative frequency barplot to illustrate how the representation from Non-European and South American teams change across the different World Cup rounds and over time. Since we want to explore the relative proportions of teams from each continent across the World Cup rounds, we thought it was best to use a segmented relative frequency barplot and fill by continent to allow for straightforward and direct comparison across groups. In addition, we chose to look at relative frequencies rather than counts since the number of teams varies for each round of the World Cup. We will order the rounds on the y axis from the earlier rounds to later rounds, starting with Groups and ending with the Finals. To visualize the representation in each round, we filled by continent. We will also facet by every two decades to explore how the representation across rounds of the World Cup changes over time for all World Cups in history.
Analysis
Discussion
According to Figure 3 , we can see that the dominant continent in the world cup appears to be Europe, at least from a participation perspective. Outside of the first world cup (which took place in Uruguay) that has more South American teams than European teams, Europe is the most represented continent, even making up a majority up until the 90s. However, while Europe is still the most represented continent today, that share has been greatly diminished. We can see that the proportion World cup teams that come from Europe slowly decreases over time, especially after the addition of more teams in 1982 and 1998. For example, since the addition of more team sin 1982, the proportion of African and Asian/Oceanic teams in the cup has nearly doubled from around 10% to 20%.
So what might be the reason for Europe early dominance and recent decline? Europe has always been a powerhouse in football. Even at the last world cup, Europe had 7 of the top 10 teams coming into the world cup (according to 538, a sports analytics site), with the other 3 belonging to South America. However, since the addition of new teams in 1982 and 1998 and the addition of new qualifying rules, there is a capped amount of European teams that can be in the cup, replaced by an increase in space for other continents. For example, in the last world cup, there were 5 spots reserved for African teams, and for the next world cup, when the number of teams increases to 48, 9 of those spots will be reserved for Africans. One might ask whether these rule changes are good for the sport if European teams seem to be the most dominant? Why not just have the 32 best teams in the world? Because that would defying the point of the world cup. The world cup is one of the single most important and unifying events in the world. The entire globe comes together to watch a the world cup, and reserving it to Europe and South America would no longer make it a ‘world’ cup. Furthermore, as we saw this year, despite it being linked to the bottom quarter of teams in the cup according to sports analytics, Morocco made a run to the semi-finals, beating teams like Portugal, Spain and Belgium. So the movement we see in the graph with more representation is, in our eyes, a great thing for the sport highlights a bright future for the cup! Now we can look at if this increase in representation in recent years results in more representation in late rounds of the cup.
According to Figure 4, we can observe that representation from Non-European teams have increased in the earlier rounds over time from the 1930s and 1940s to the 2010s and 2020s where the proportion of African and Asian teams in earlier rounds have increased over time. For instance, some African and Asian teams have made it to and past the Quarters in the 1950s and 1960s to the 2010s and 2020s World Cups. However, the representation of Non-European teams that we see in earlier rounds decrease in later rounds such as the Semis and Finals and are mostly dominated by European and South American teams. Although we see an increase in representation of Non-European and South American teams in earlier rounds over time from the first World Cups to the most recent ones, the proportion of non-European and South American teams gradually decreases as the rounds progress with teams being eliminated each round, resulting with mostly European and South American teams remaining in the final rounds of the World Cup. Thus, an increase in representation in early rounds does not lead to more representation in later rounds.
It is also interesting to note that there is no data for the Round of 16 in the World Cups of the 1950s and 1960s. This is due to the fact that during that time, teams immediately skipped straight to the quarterfinals since there were only 16 teams. Despite this anomaly, the representation of non-European and South American teams decreased from Group to Finals round during the 1950s and 1960s.
The lack of diversity in late rounds makes sense as European and South American teams are typically considered the strongest when entering the world cup. Despite the solid diversity in group stages of late decades, the finals and semifinals look very similar to every other decade. We expect that, in the future, this will change as countries in Africa and Asia, for example, continue to improve their leagues and facilities. Eventually, we believe that the diversity of continents in the final round will look nearly identical to that of early rounds, although it may take a couple decades!