World Cup Scoring Trends & Rankings
STA/ISS 313 - Spring 2023 - Project 1
Introduction
Our investigation utilizes FIFA World Cup data including two datasets titled matches and wc
The matches dataset includes data from every World Cup game from 1930 - 2018 and its variables reflect which teams played in a match and its outcome
The wc dataset includes general information about each individual World Cup with variables like tournament host, year, and which nations placed first through fourth
Question 1: How has aggregate goal count per match changed over time, and does the round in which a match is played correlate with this metric?
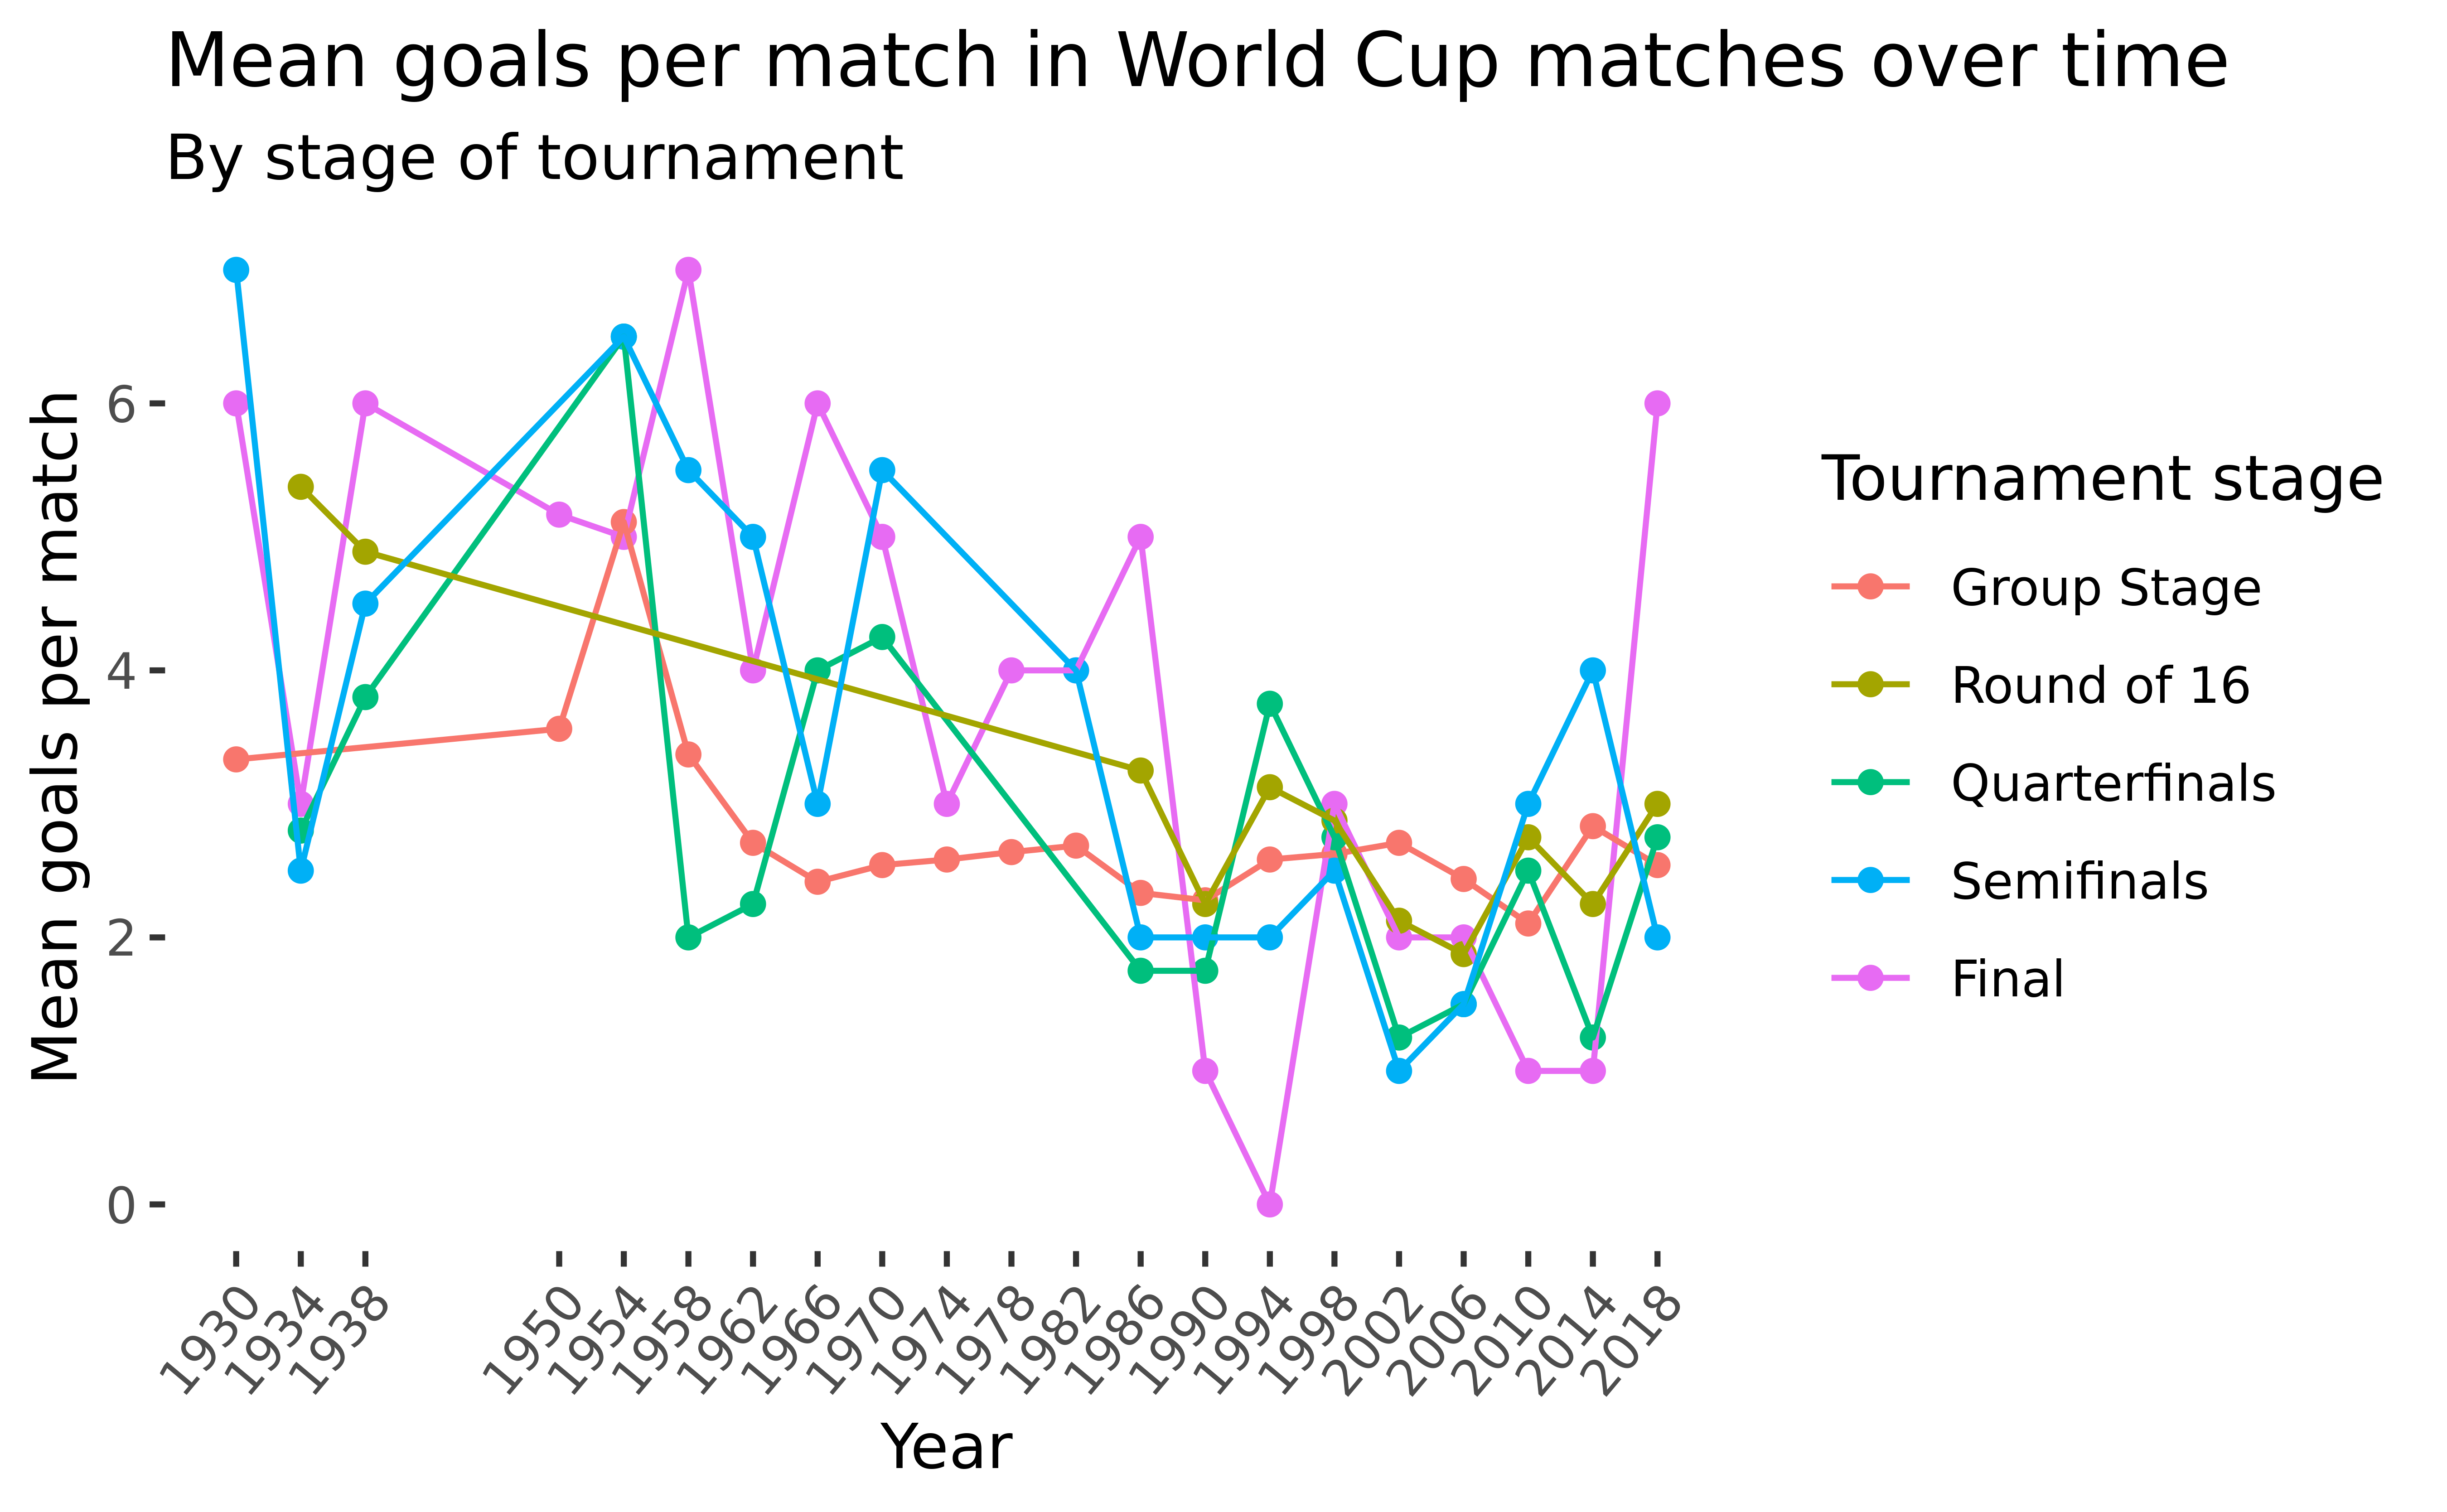
Goals per match over time
![]()
Figure 1
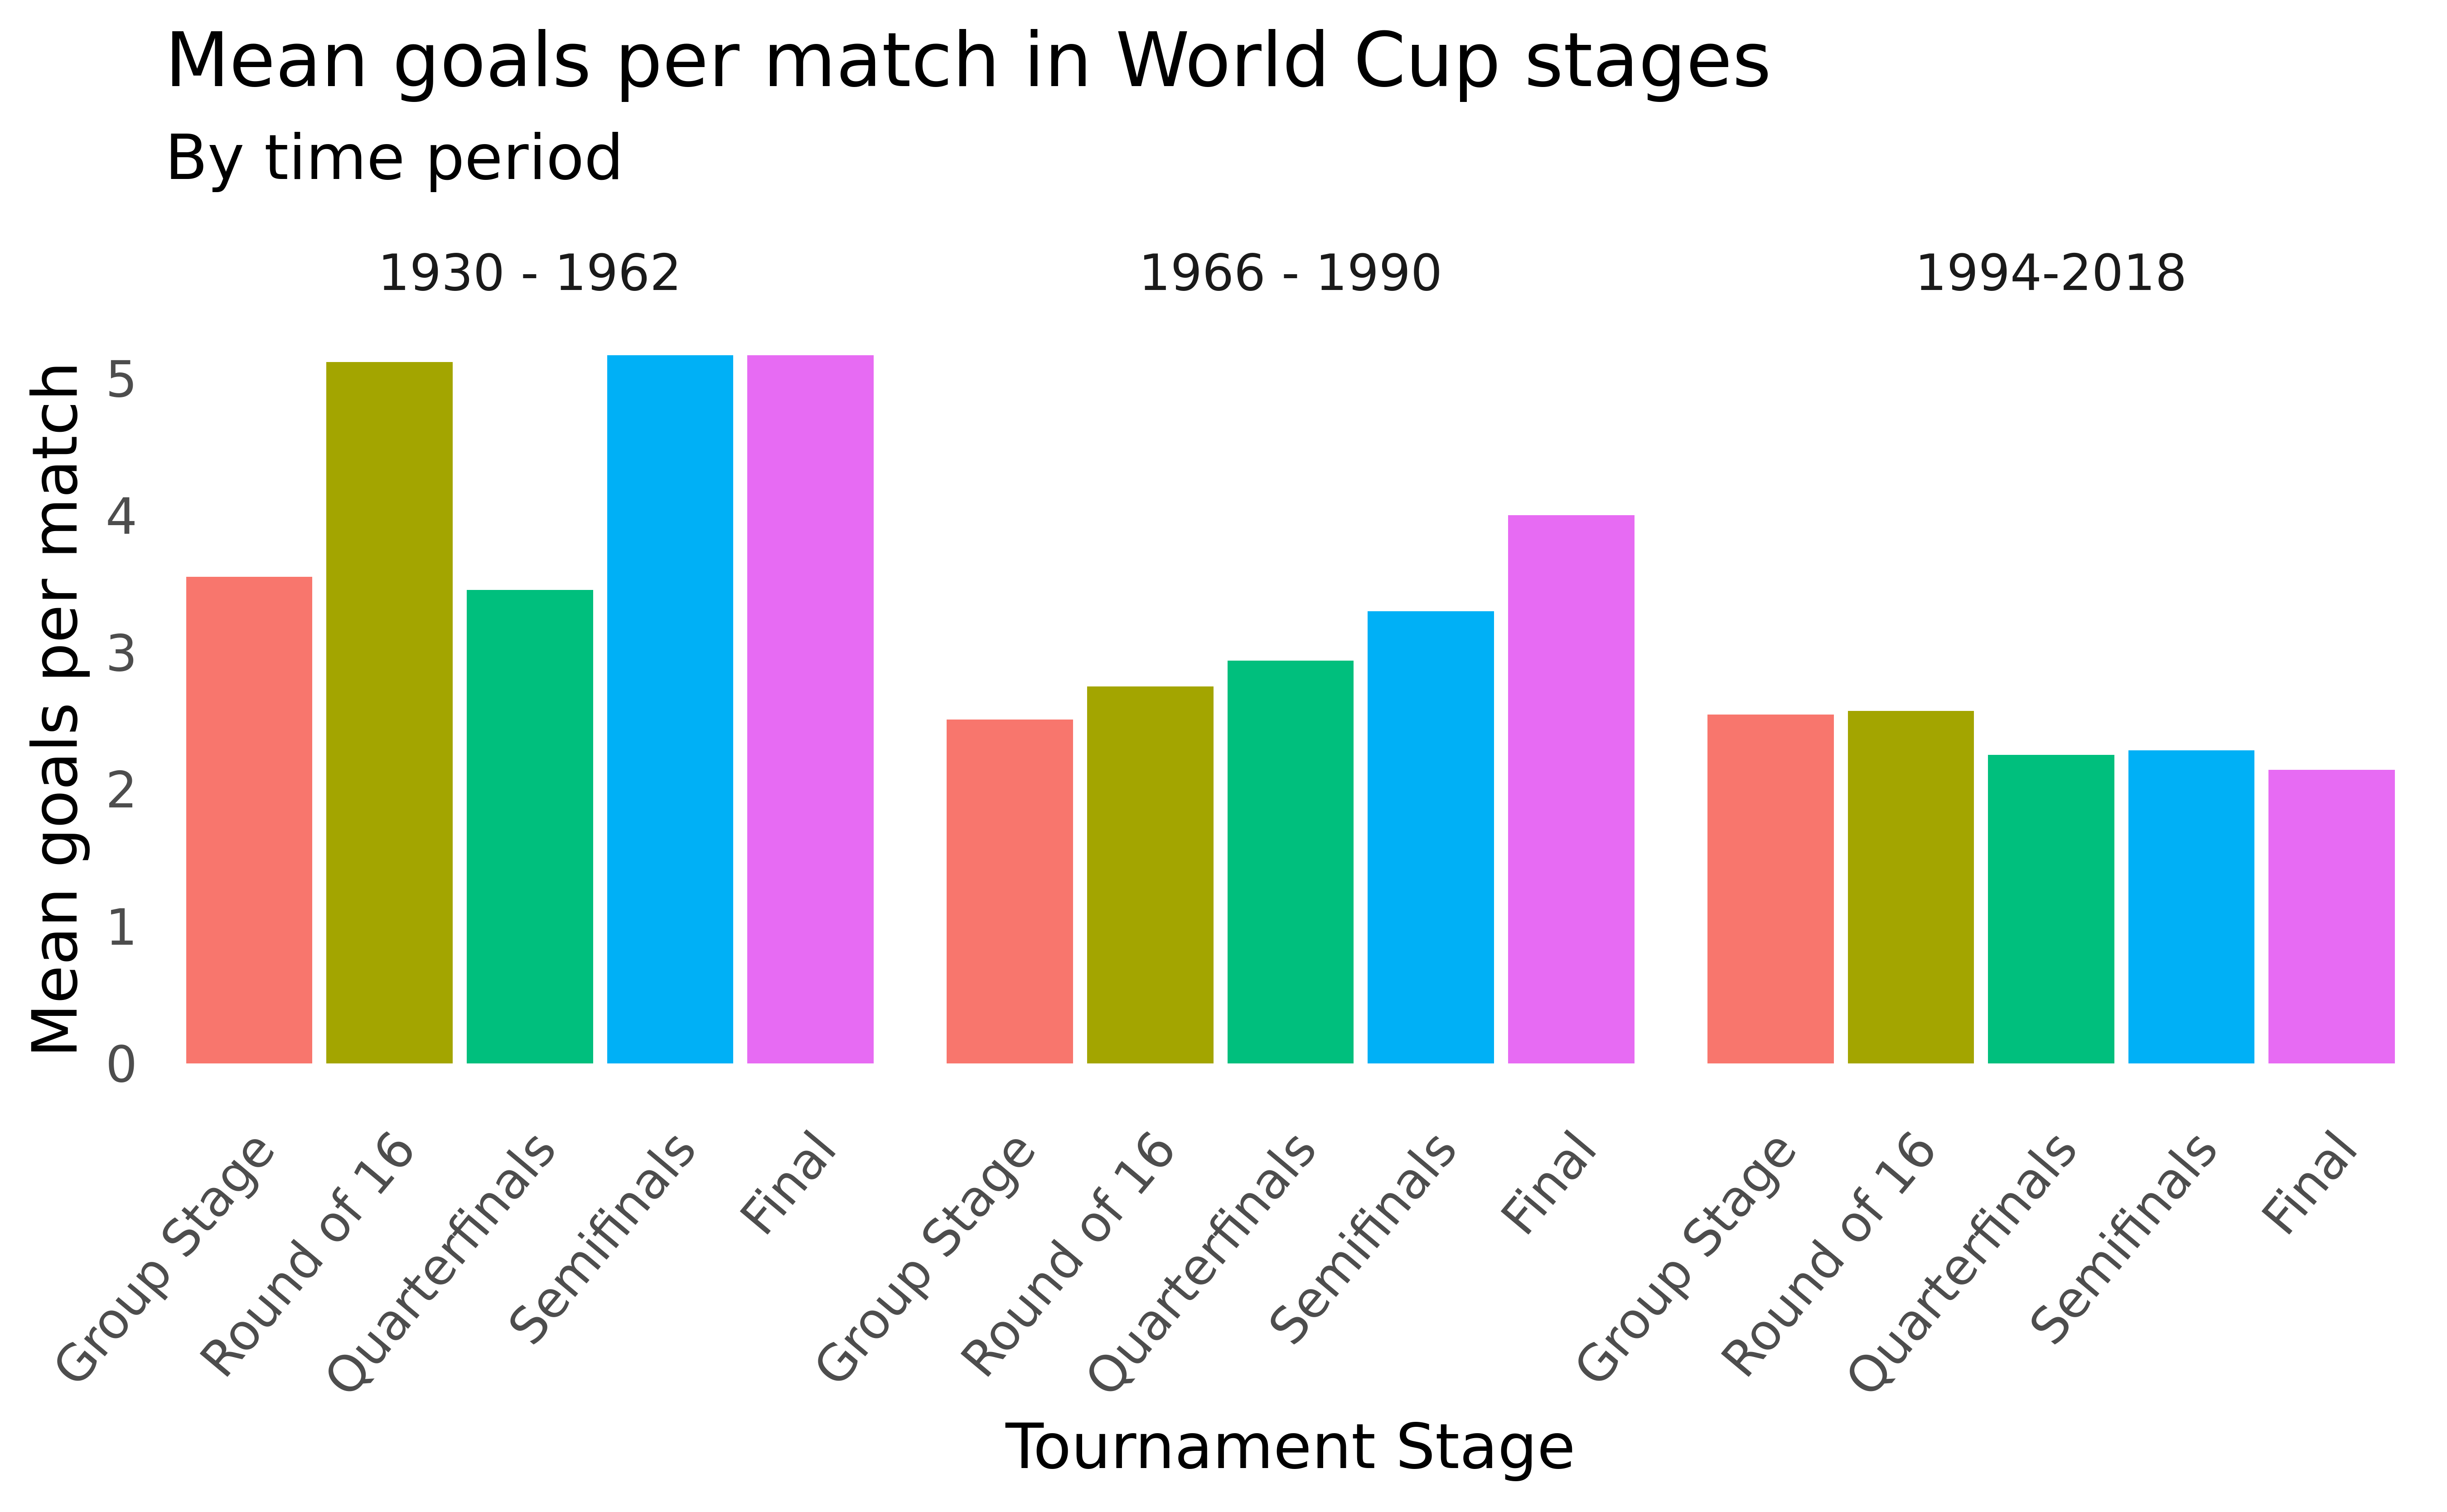
Goals per match by tournament stage
![]()
Figure 2
Discussion
It is challenging to discern any concrete trends as far as goal tally having a strong relationship with tournament stage
Goals per match seem to be most consistent in the Group stage (2 to 3 goals per match) which makes sense given it sees the highest amount of matches
Overall, it seems that goals per match have declined over time with countries recently becoming more conservative in later rounds
Question 2: Over the course of the FIFA World Cup’s tenure, which nations have had the most success aggregated across all tournaments from 1930 to 2018 when considering semi-final appearances and overall goal differential?
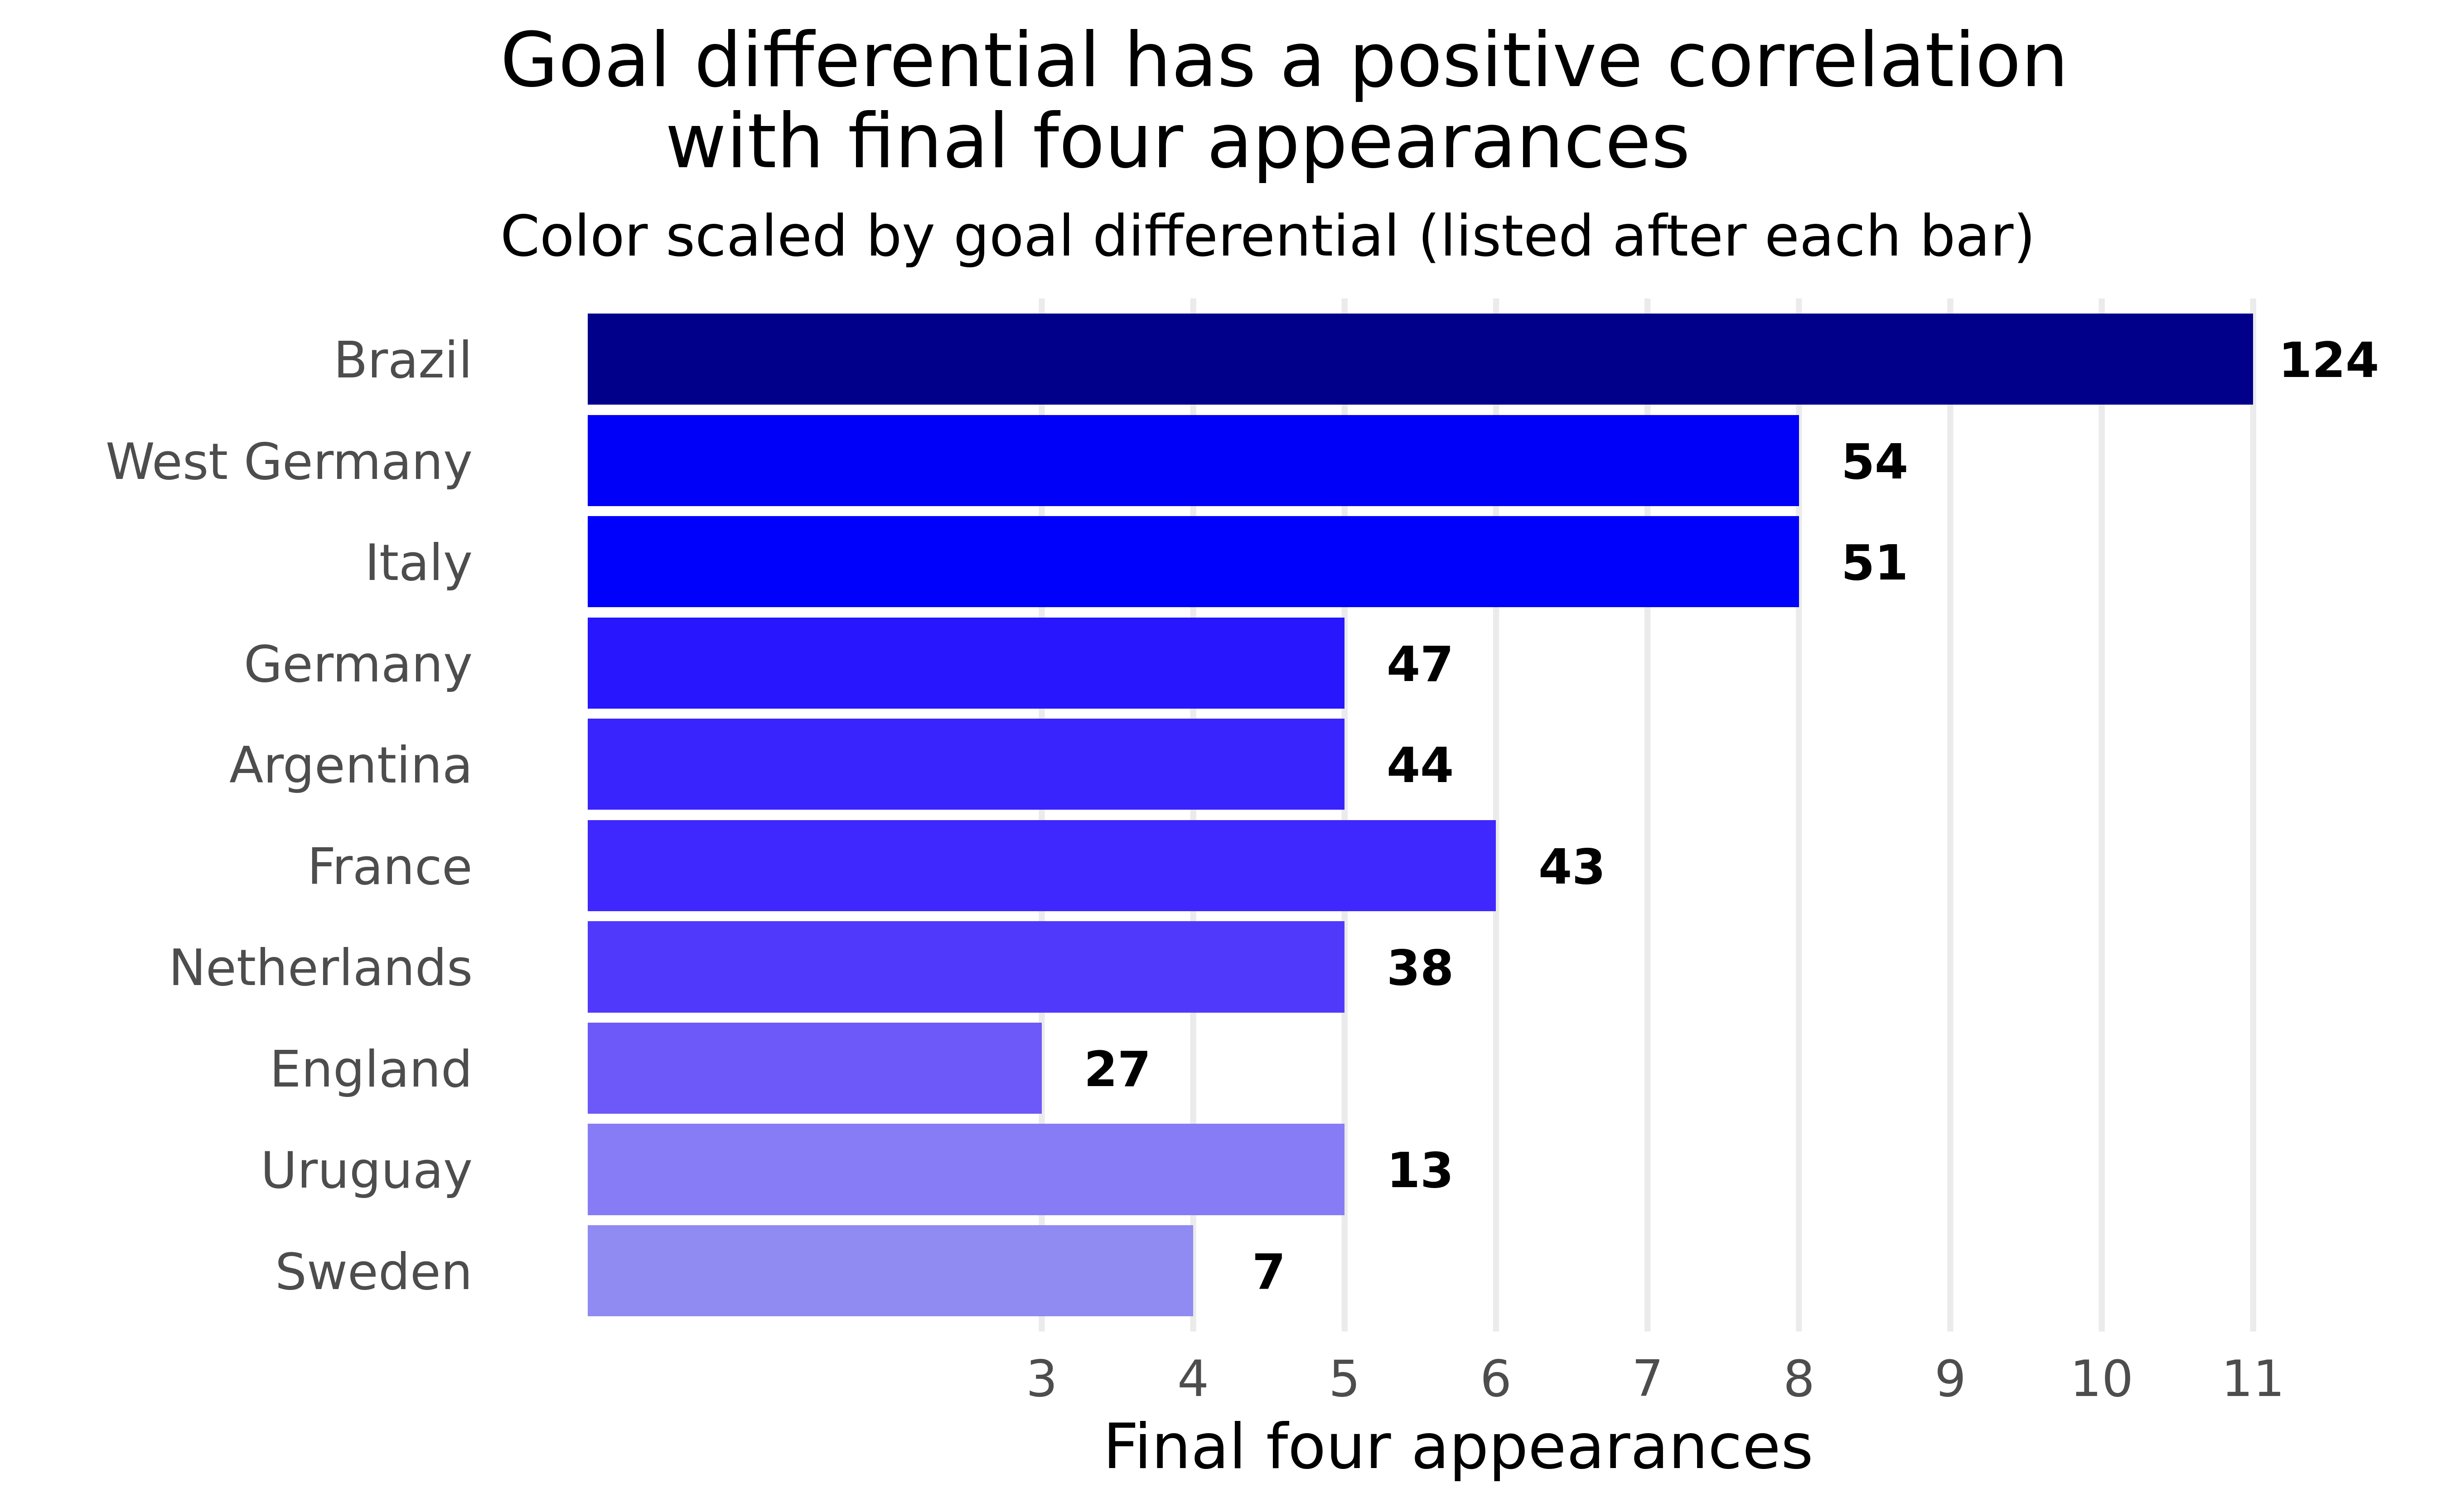
Rankings: semifinal appearances
![]()
Figure 3
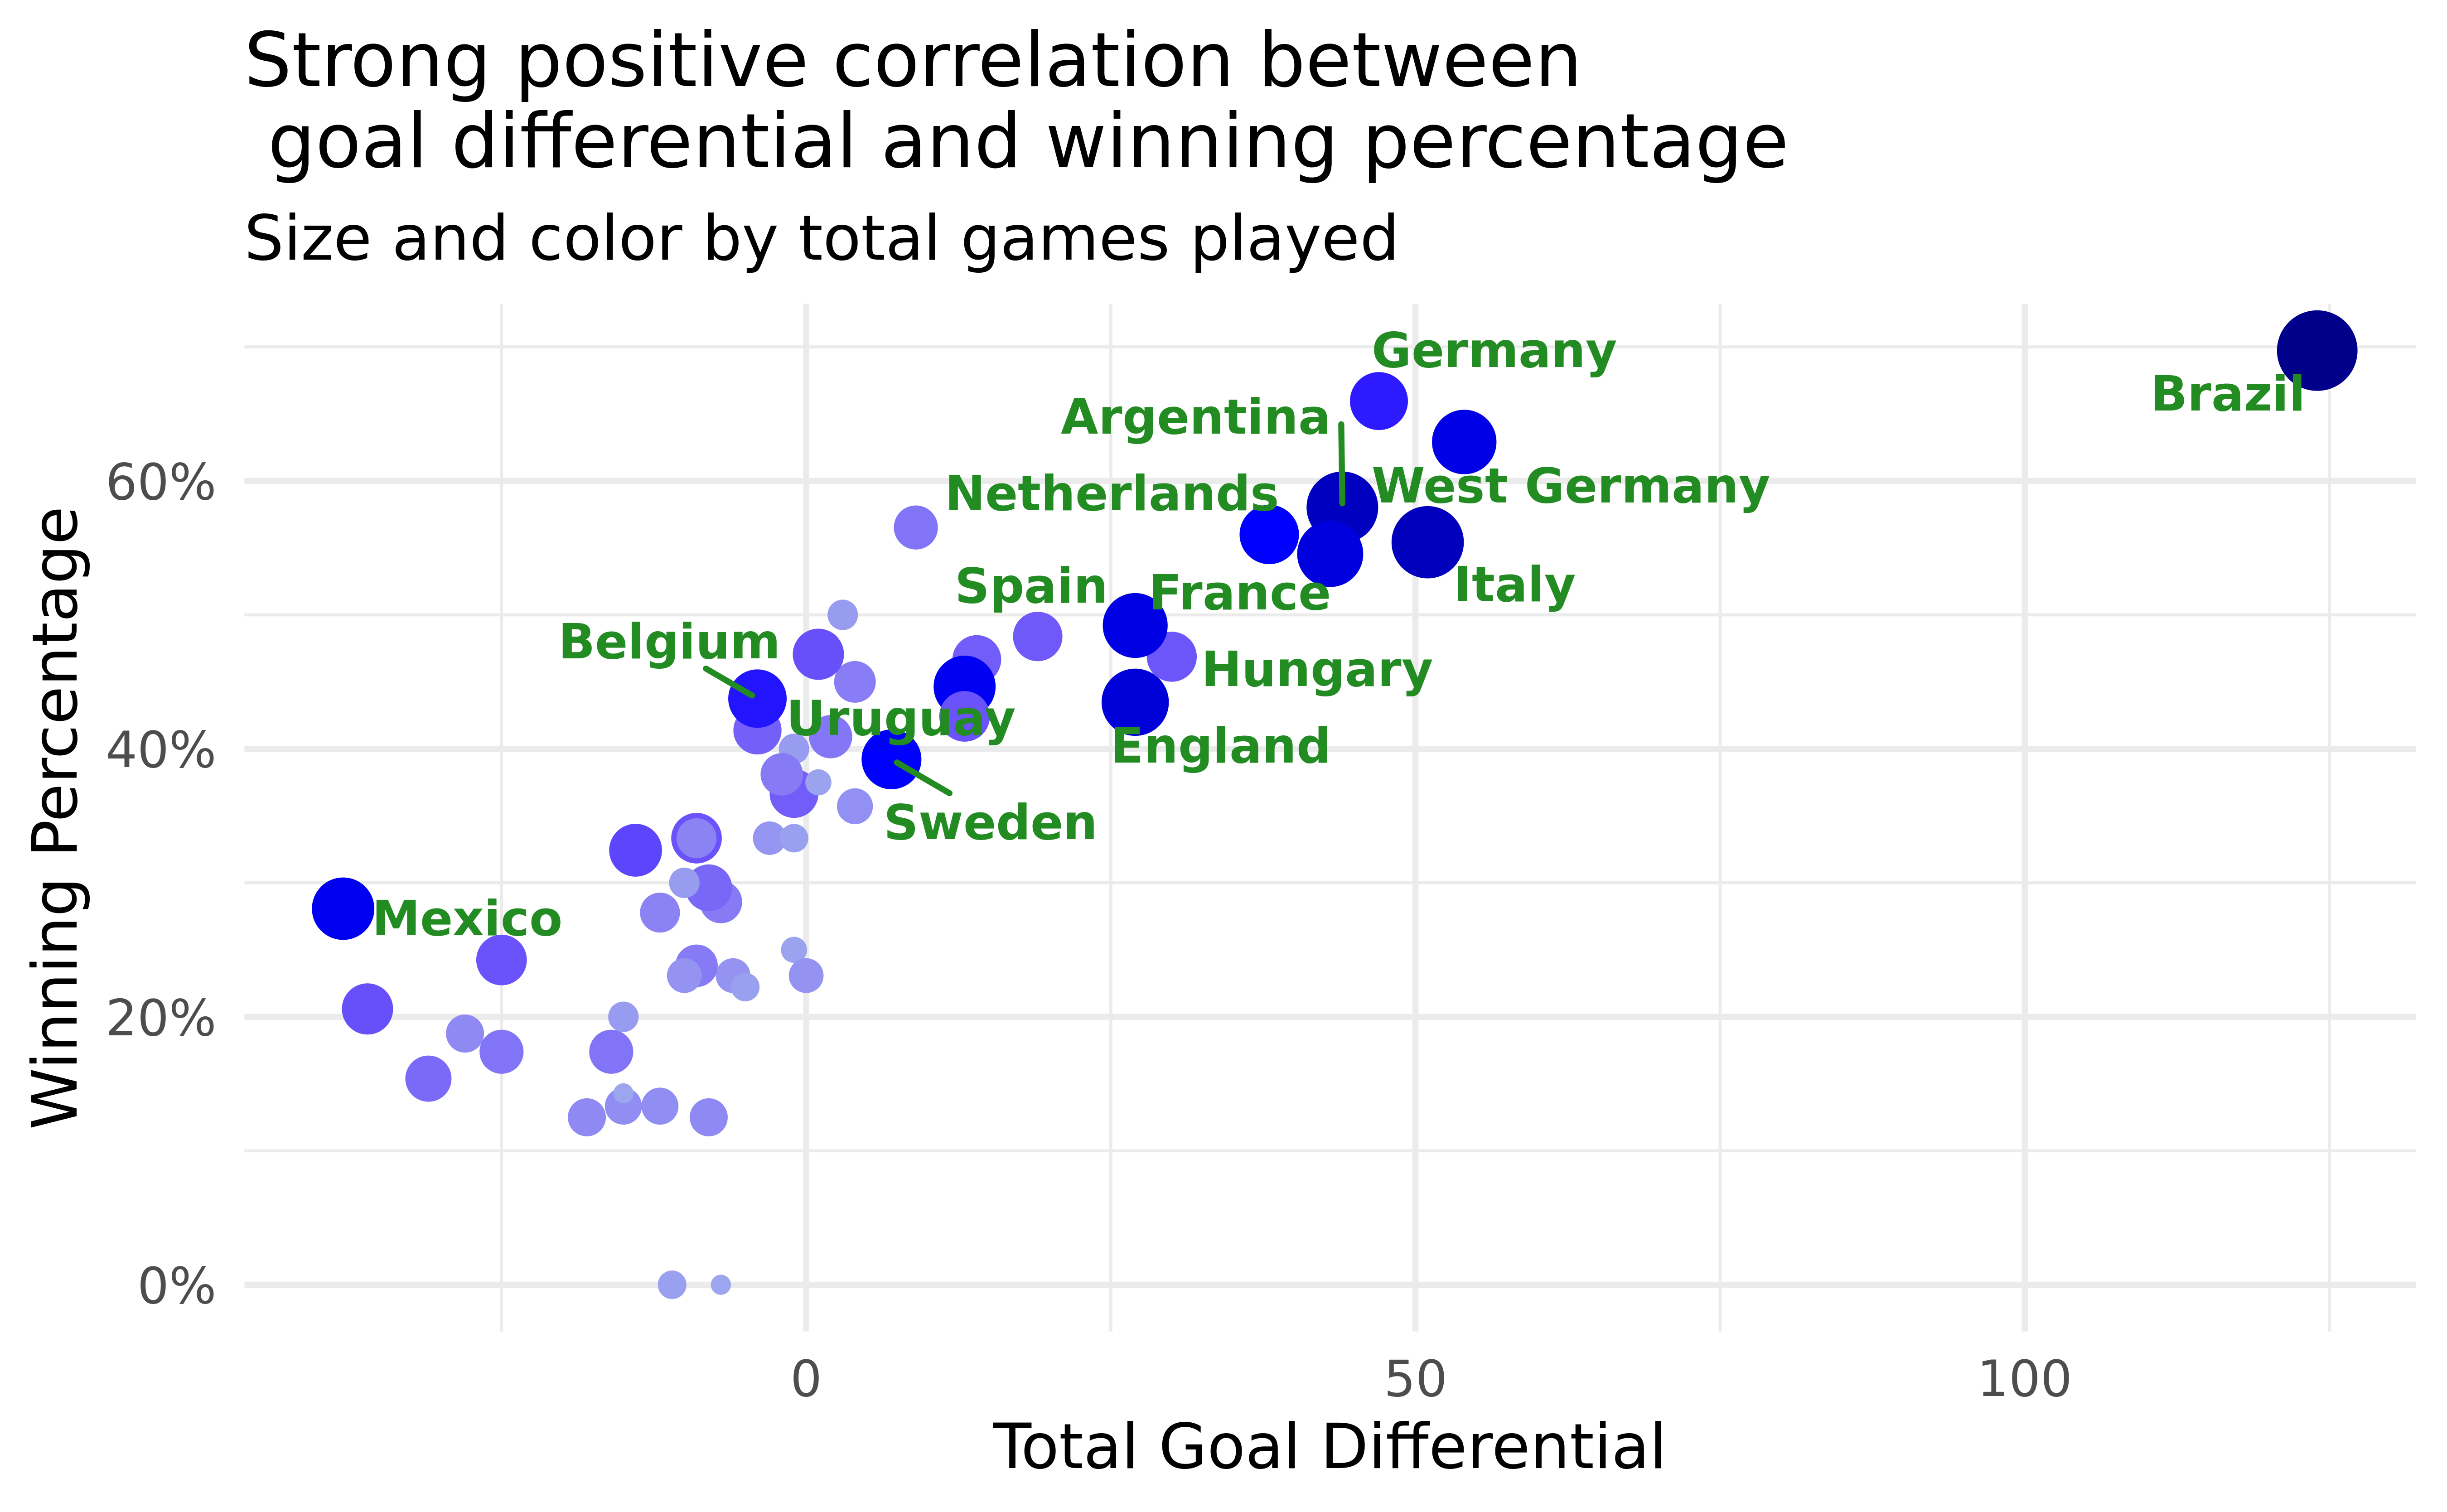
Rankings: goal differential and win %
![]()
Figure 4
Discussion
The first plot demonstrates that total goal differential and final four appearances have a strong relationship
This research question has given us insight into which teams consistently perform the best in the history of the World Cup, that being Brazil, Germany, and Italy