STA/ISS 313 - Spring 2023 - Project 1
Creator: Timothy Renner, Data World 2017
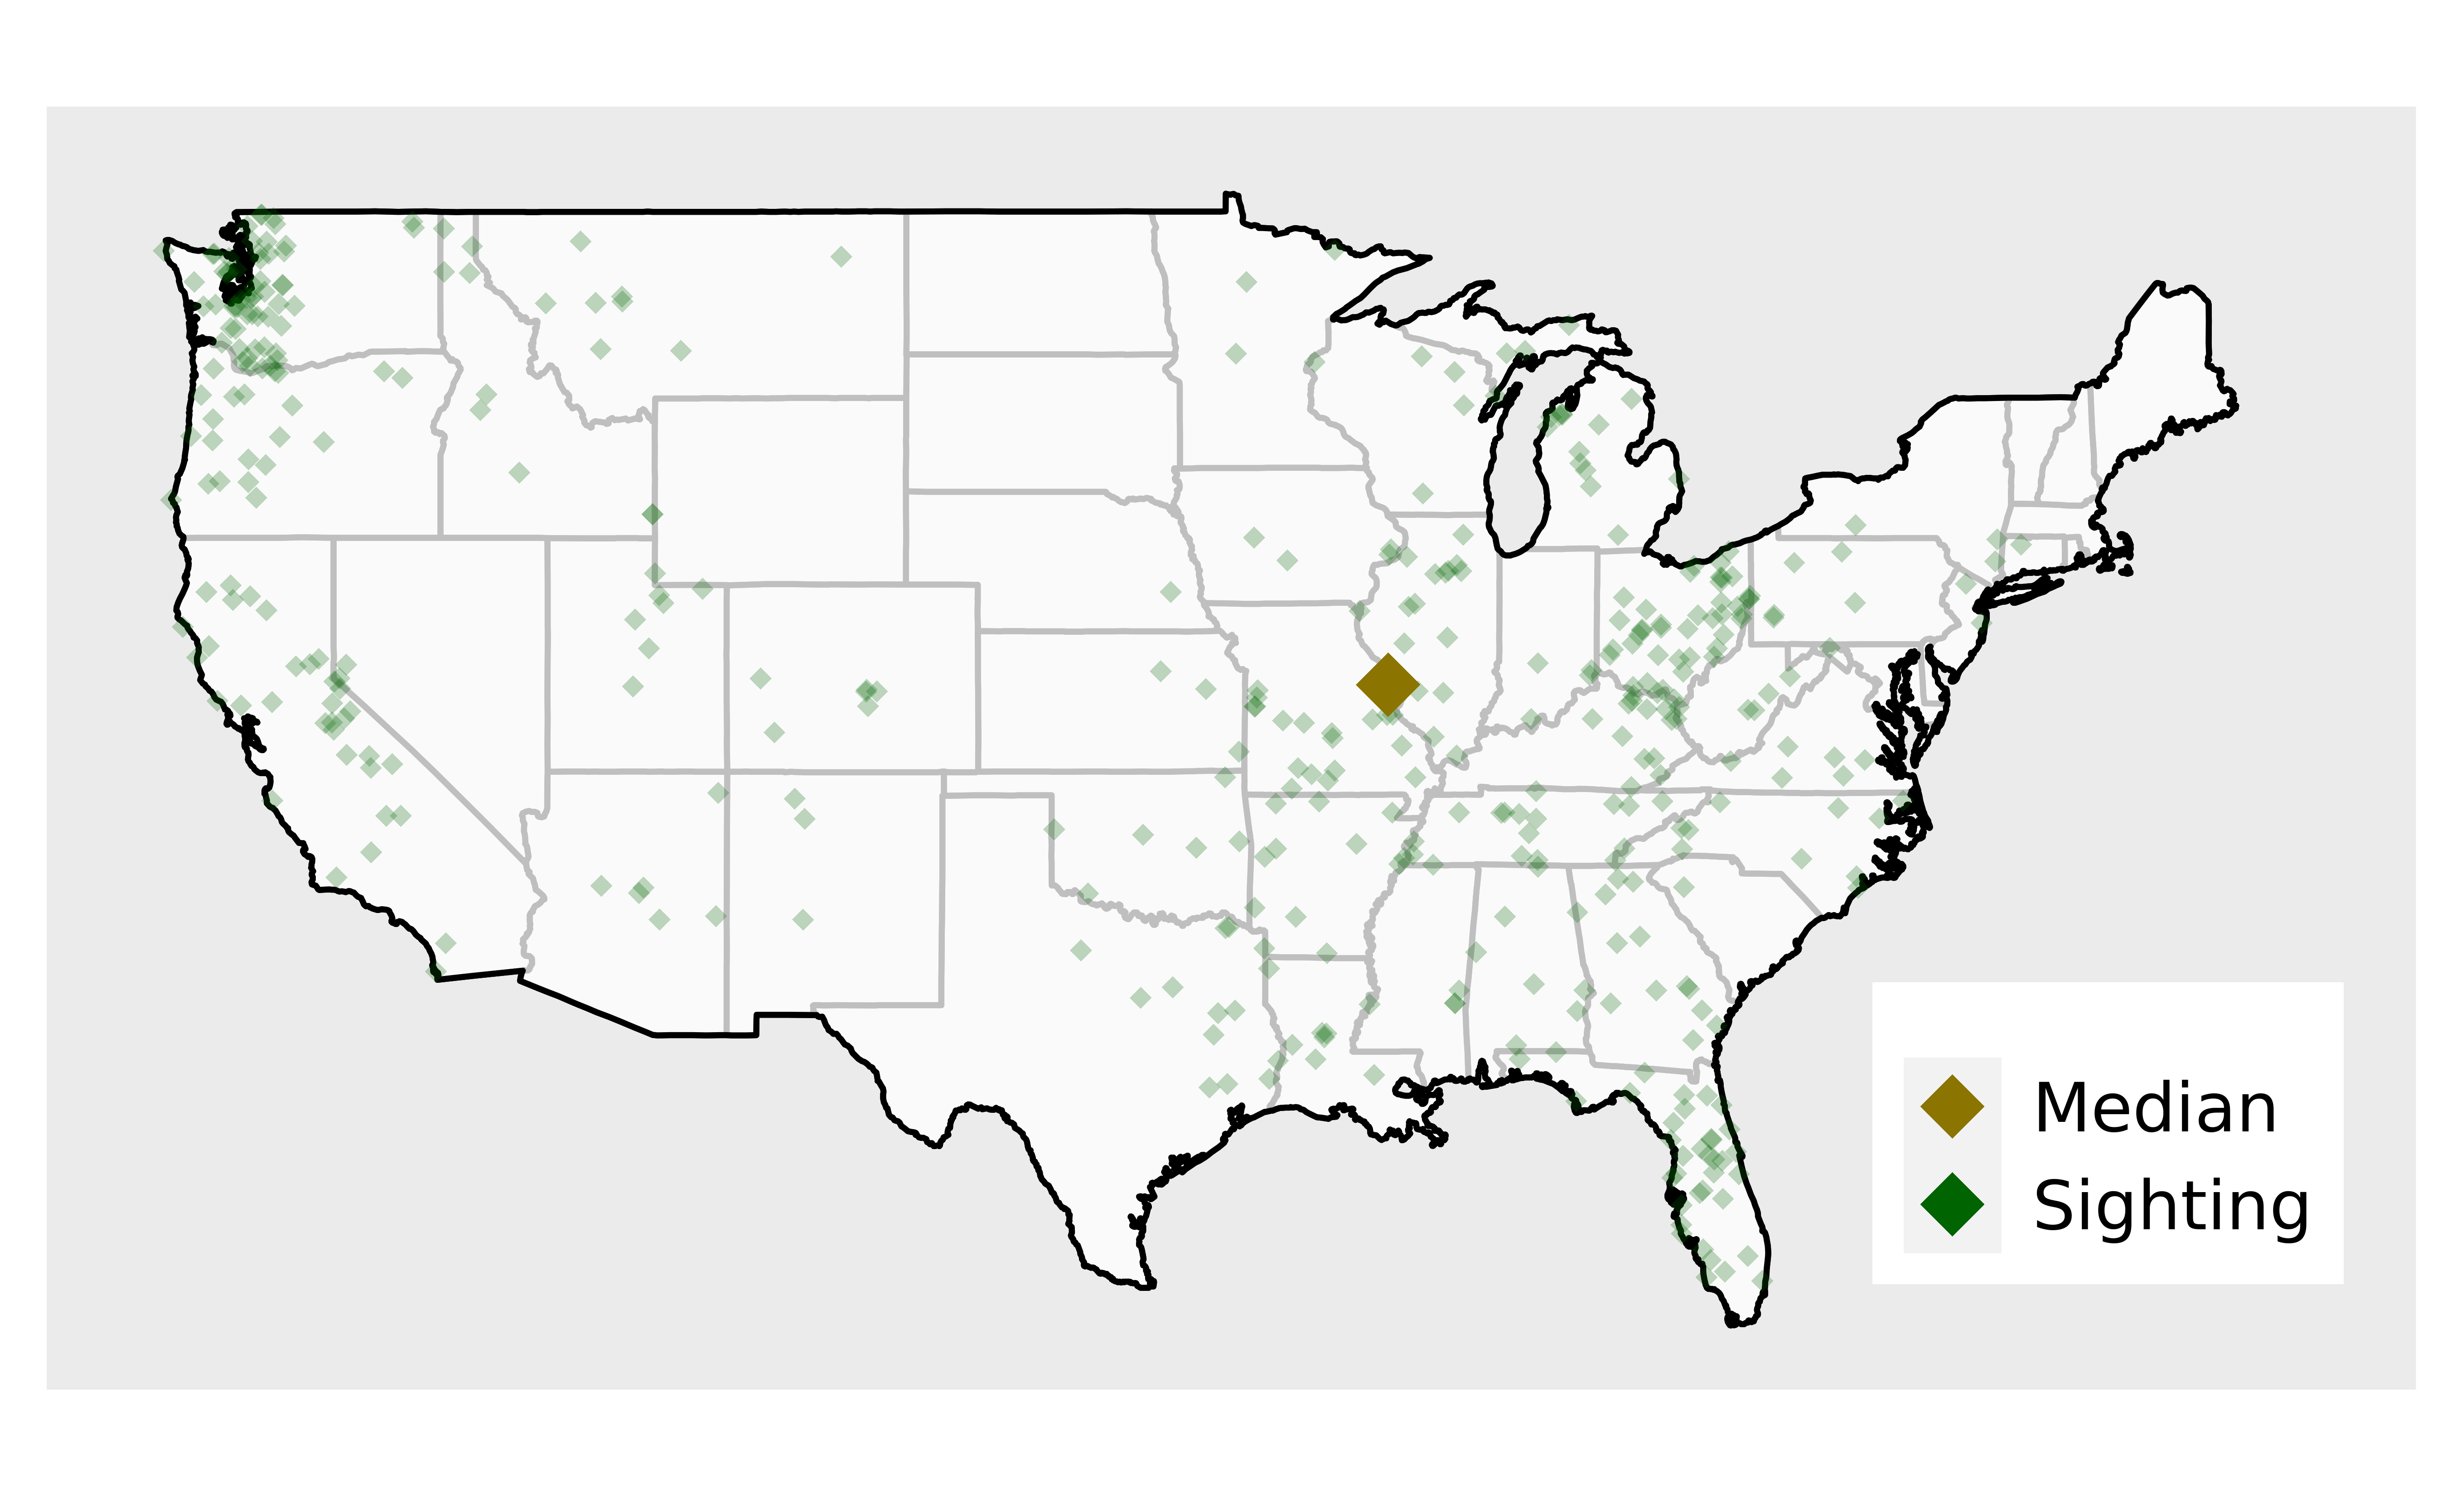
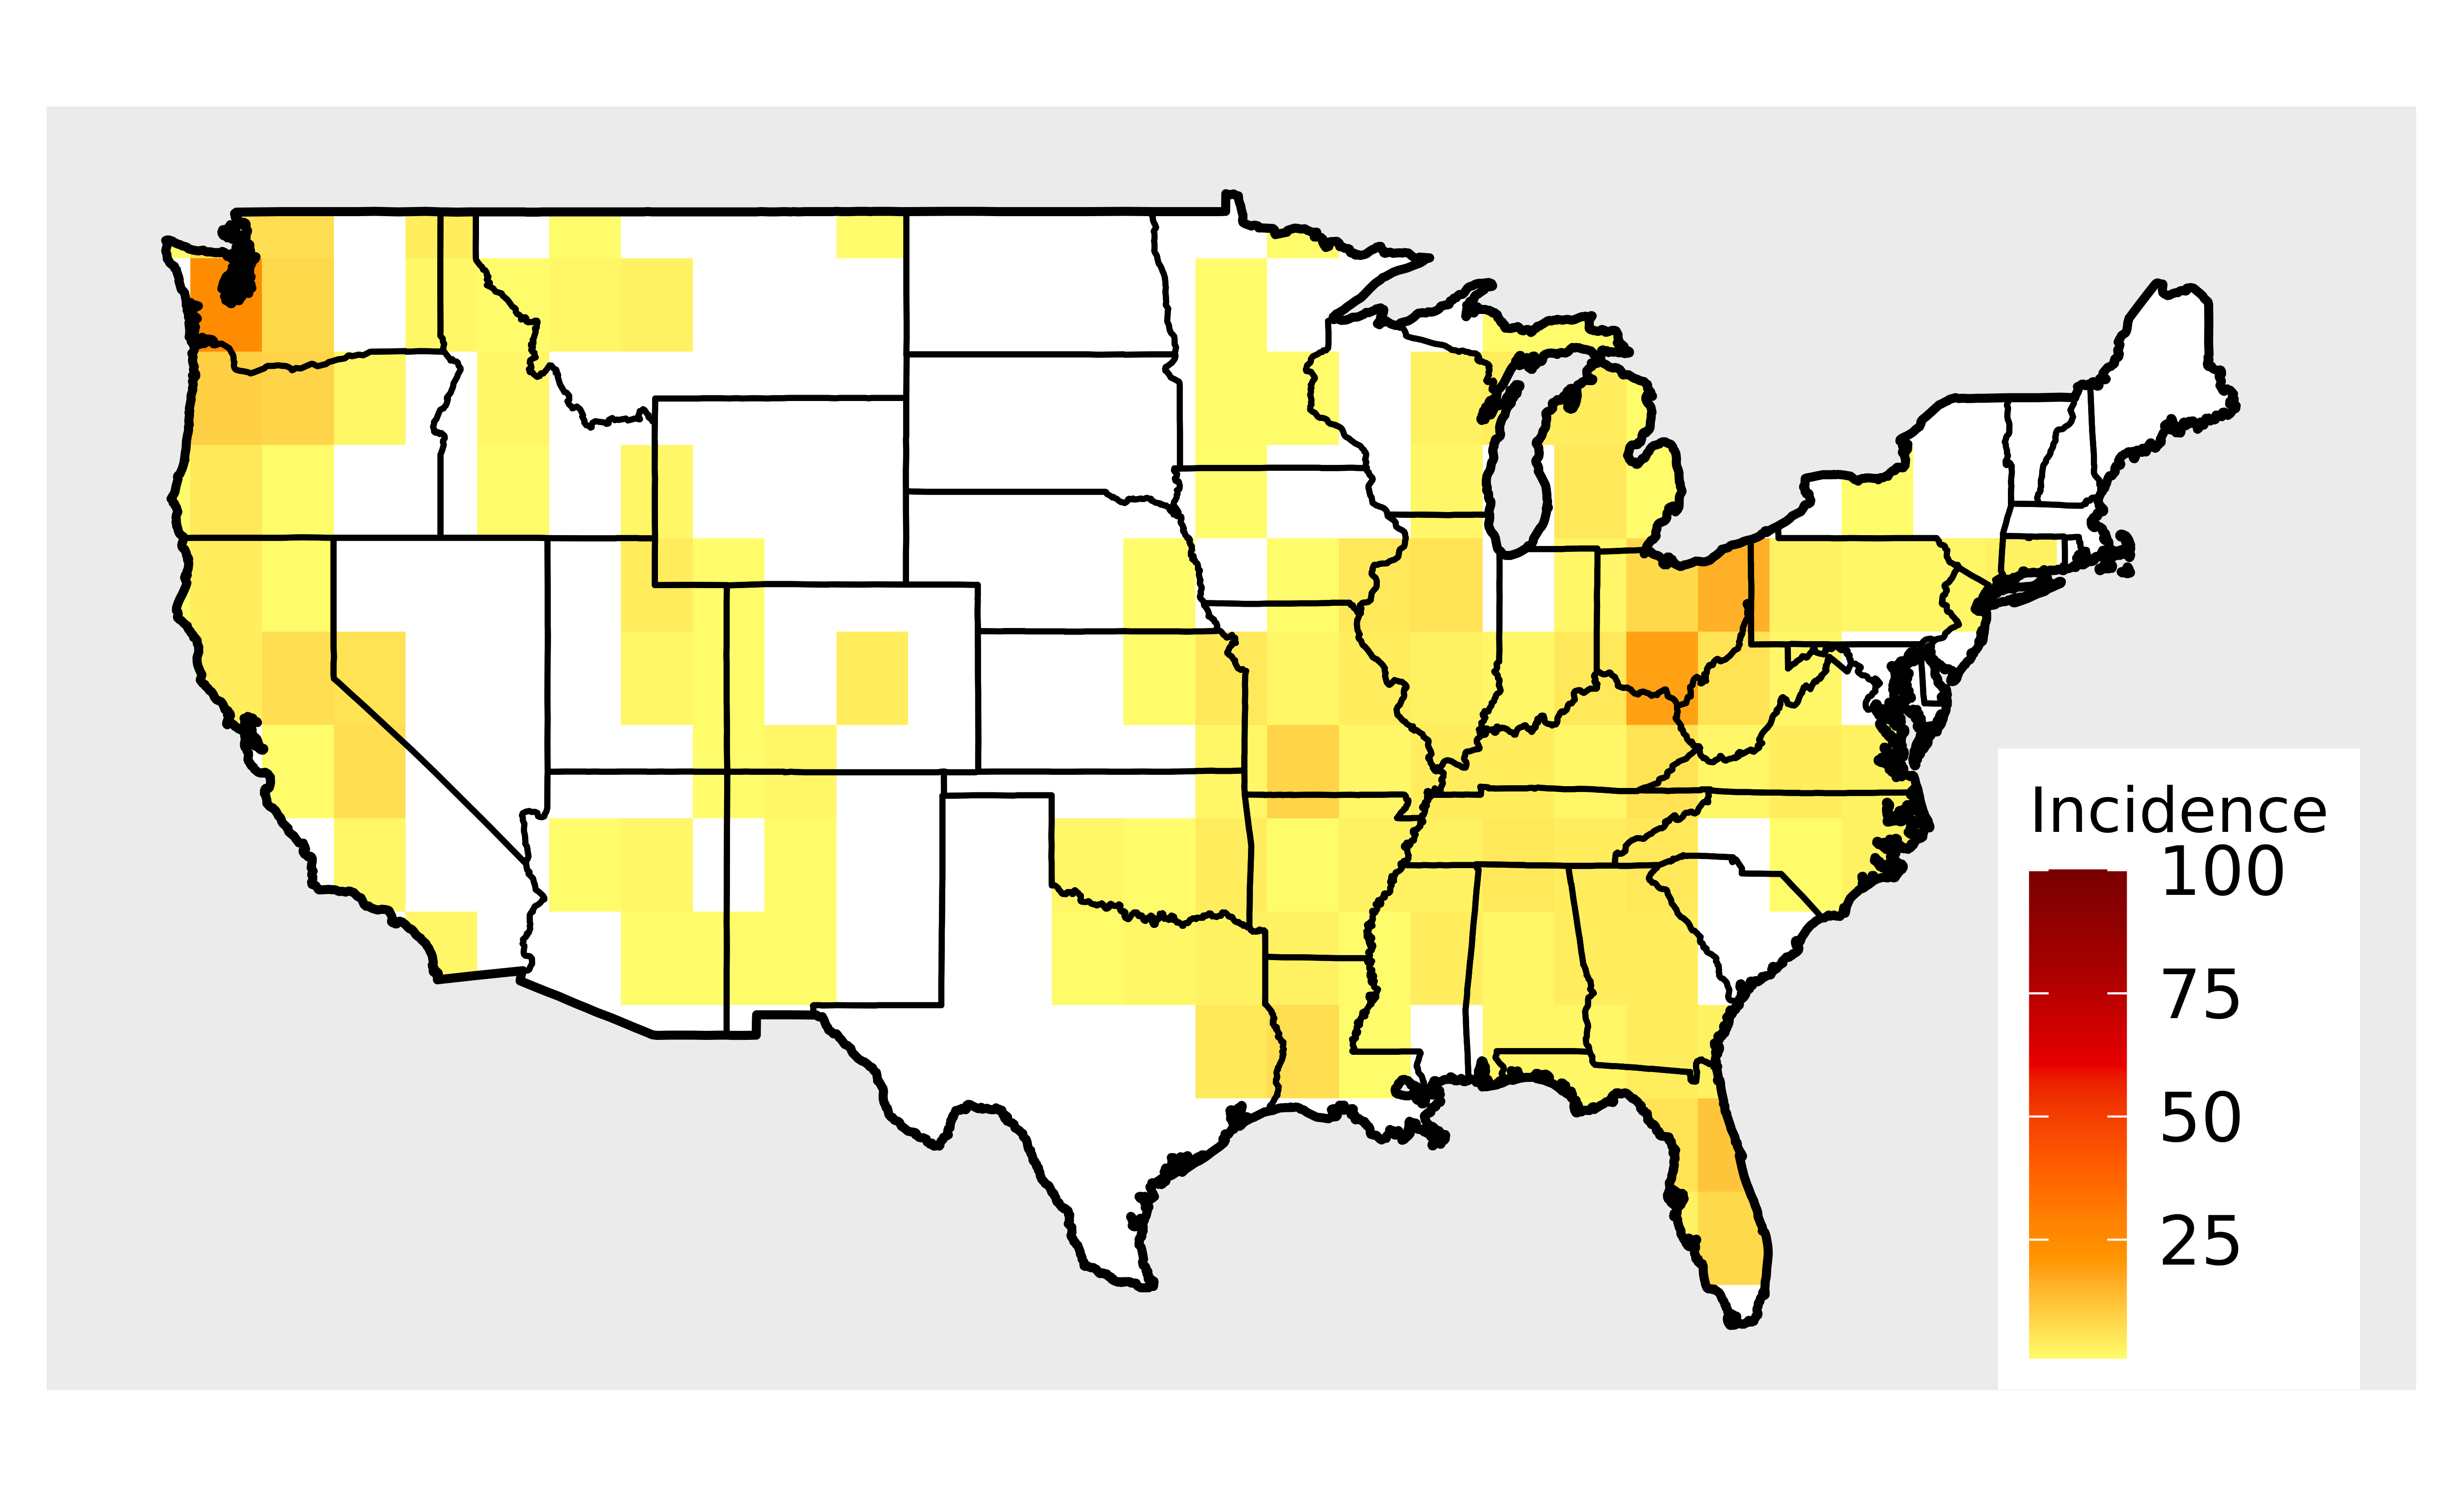
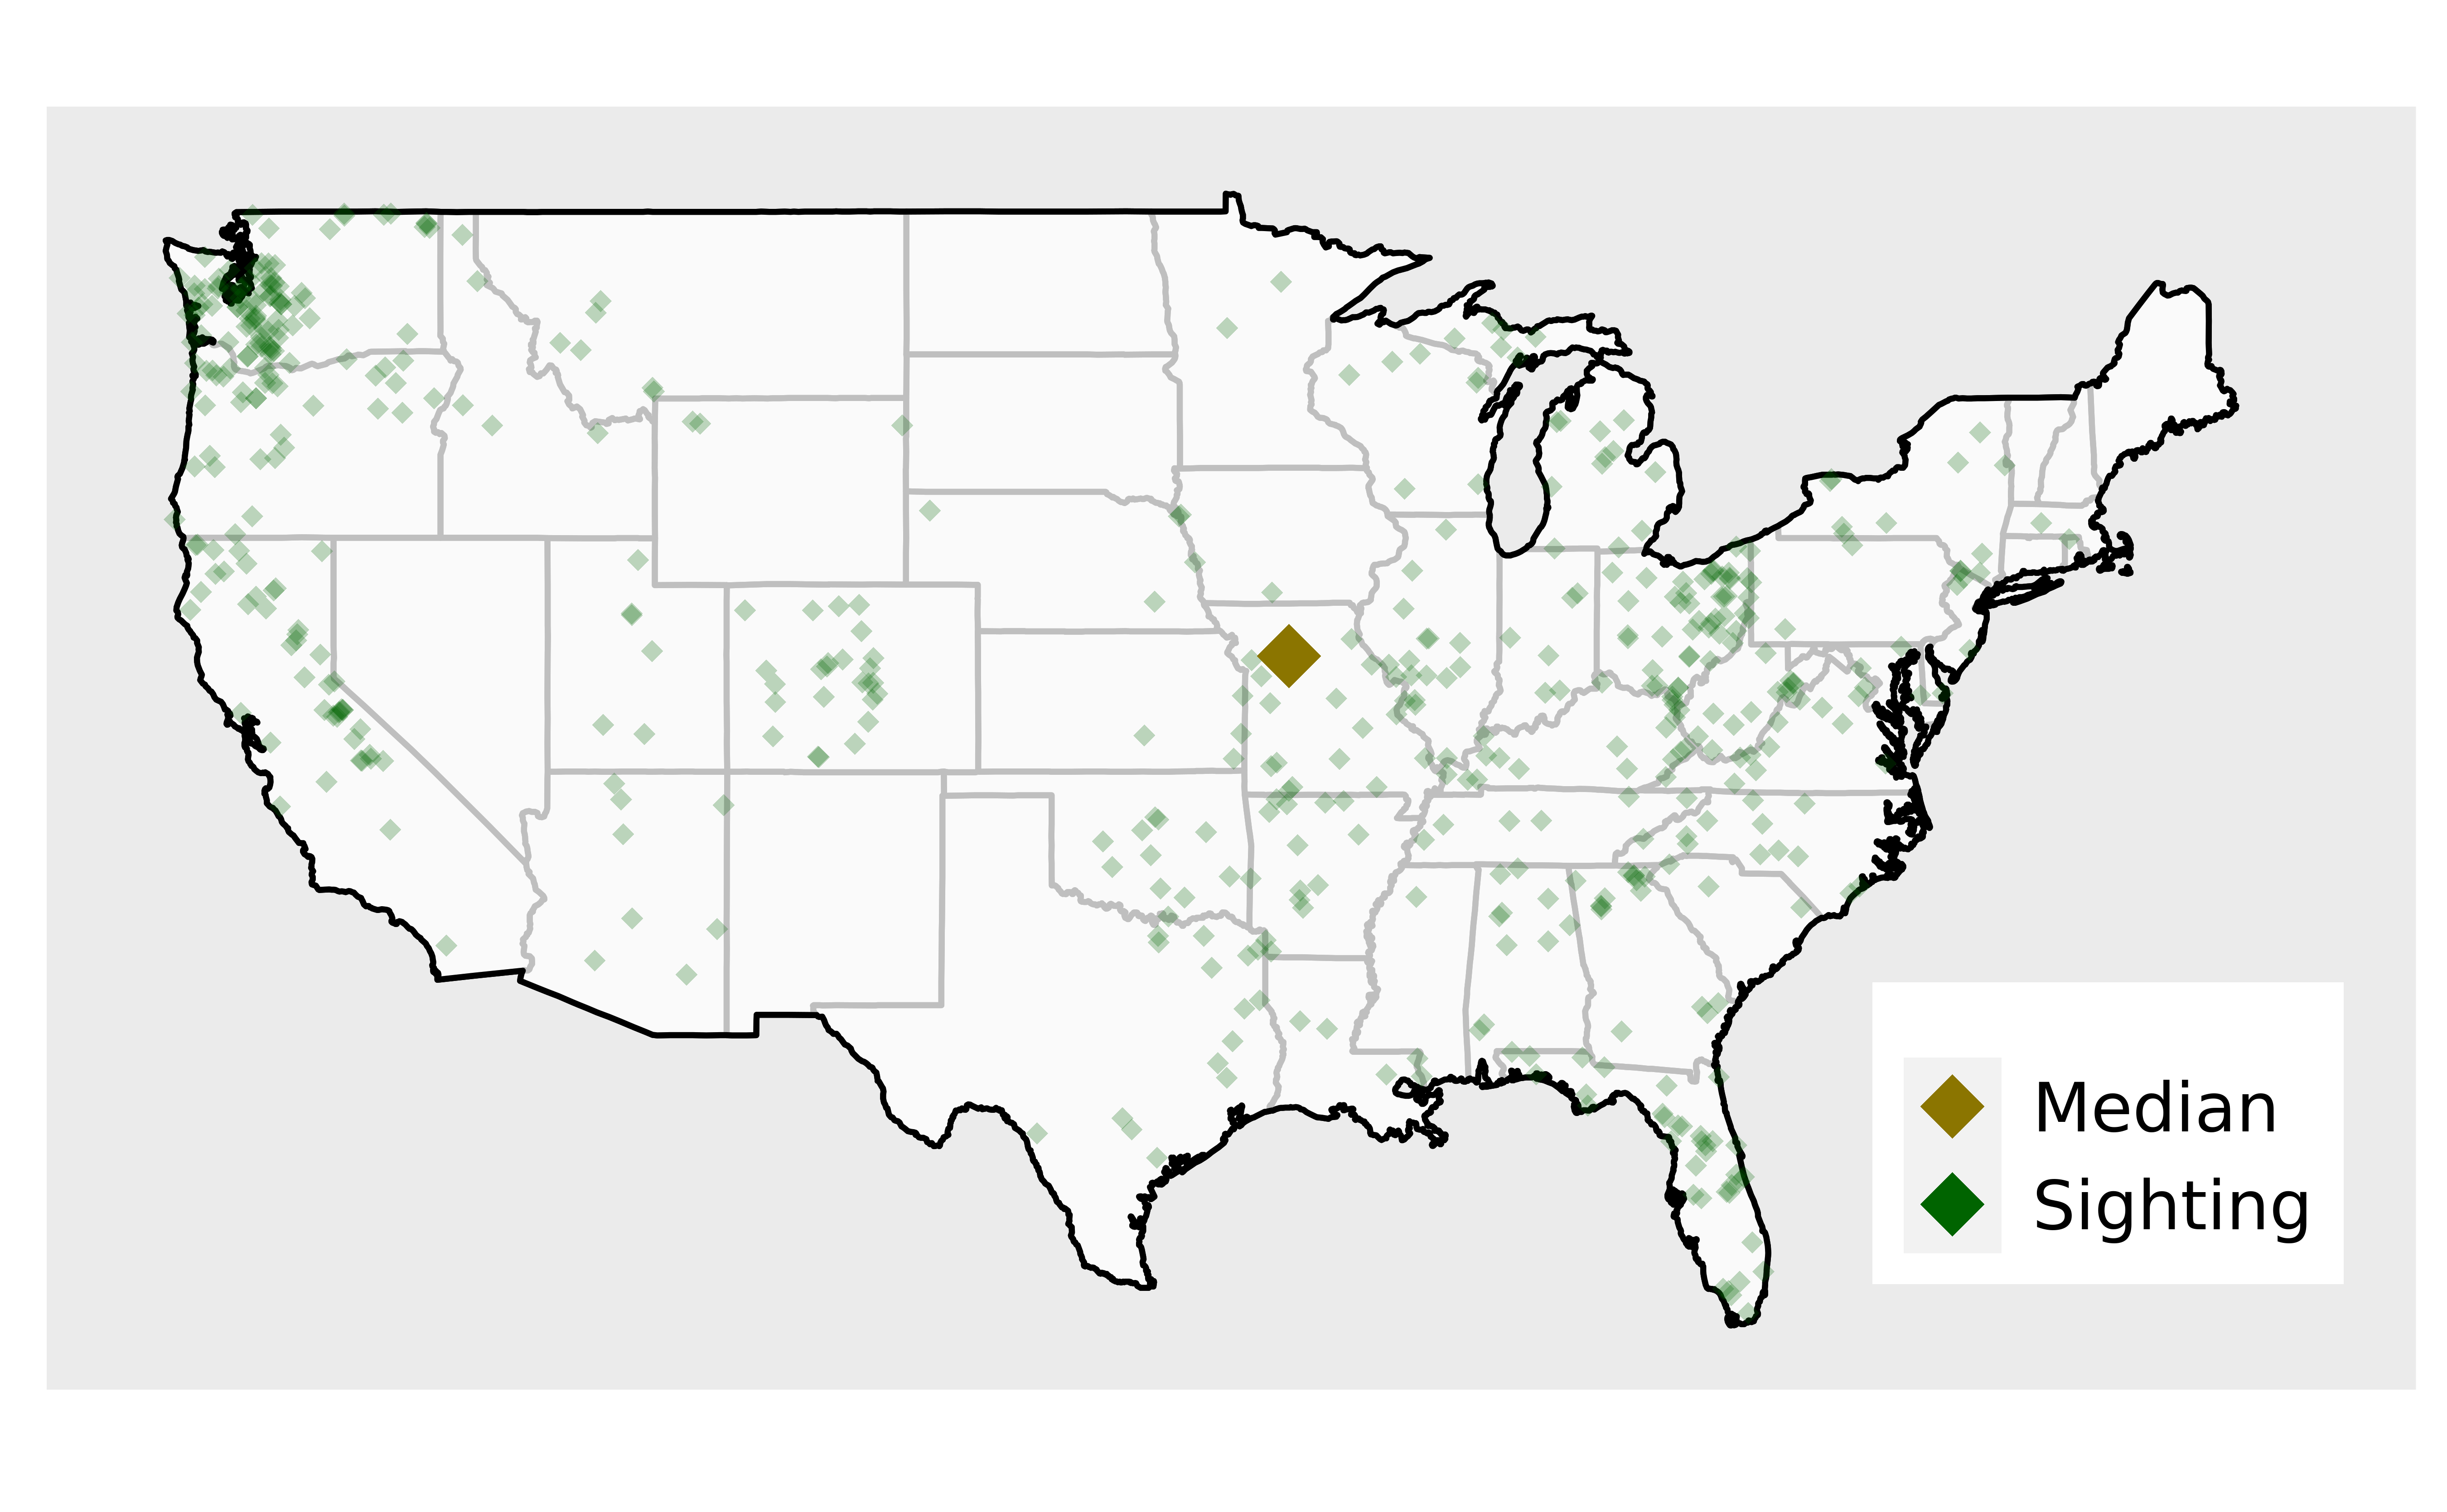
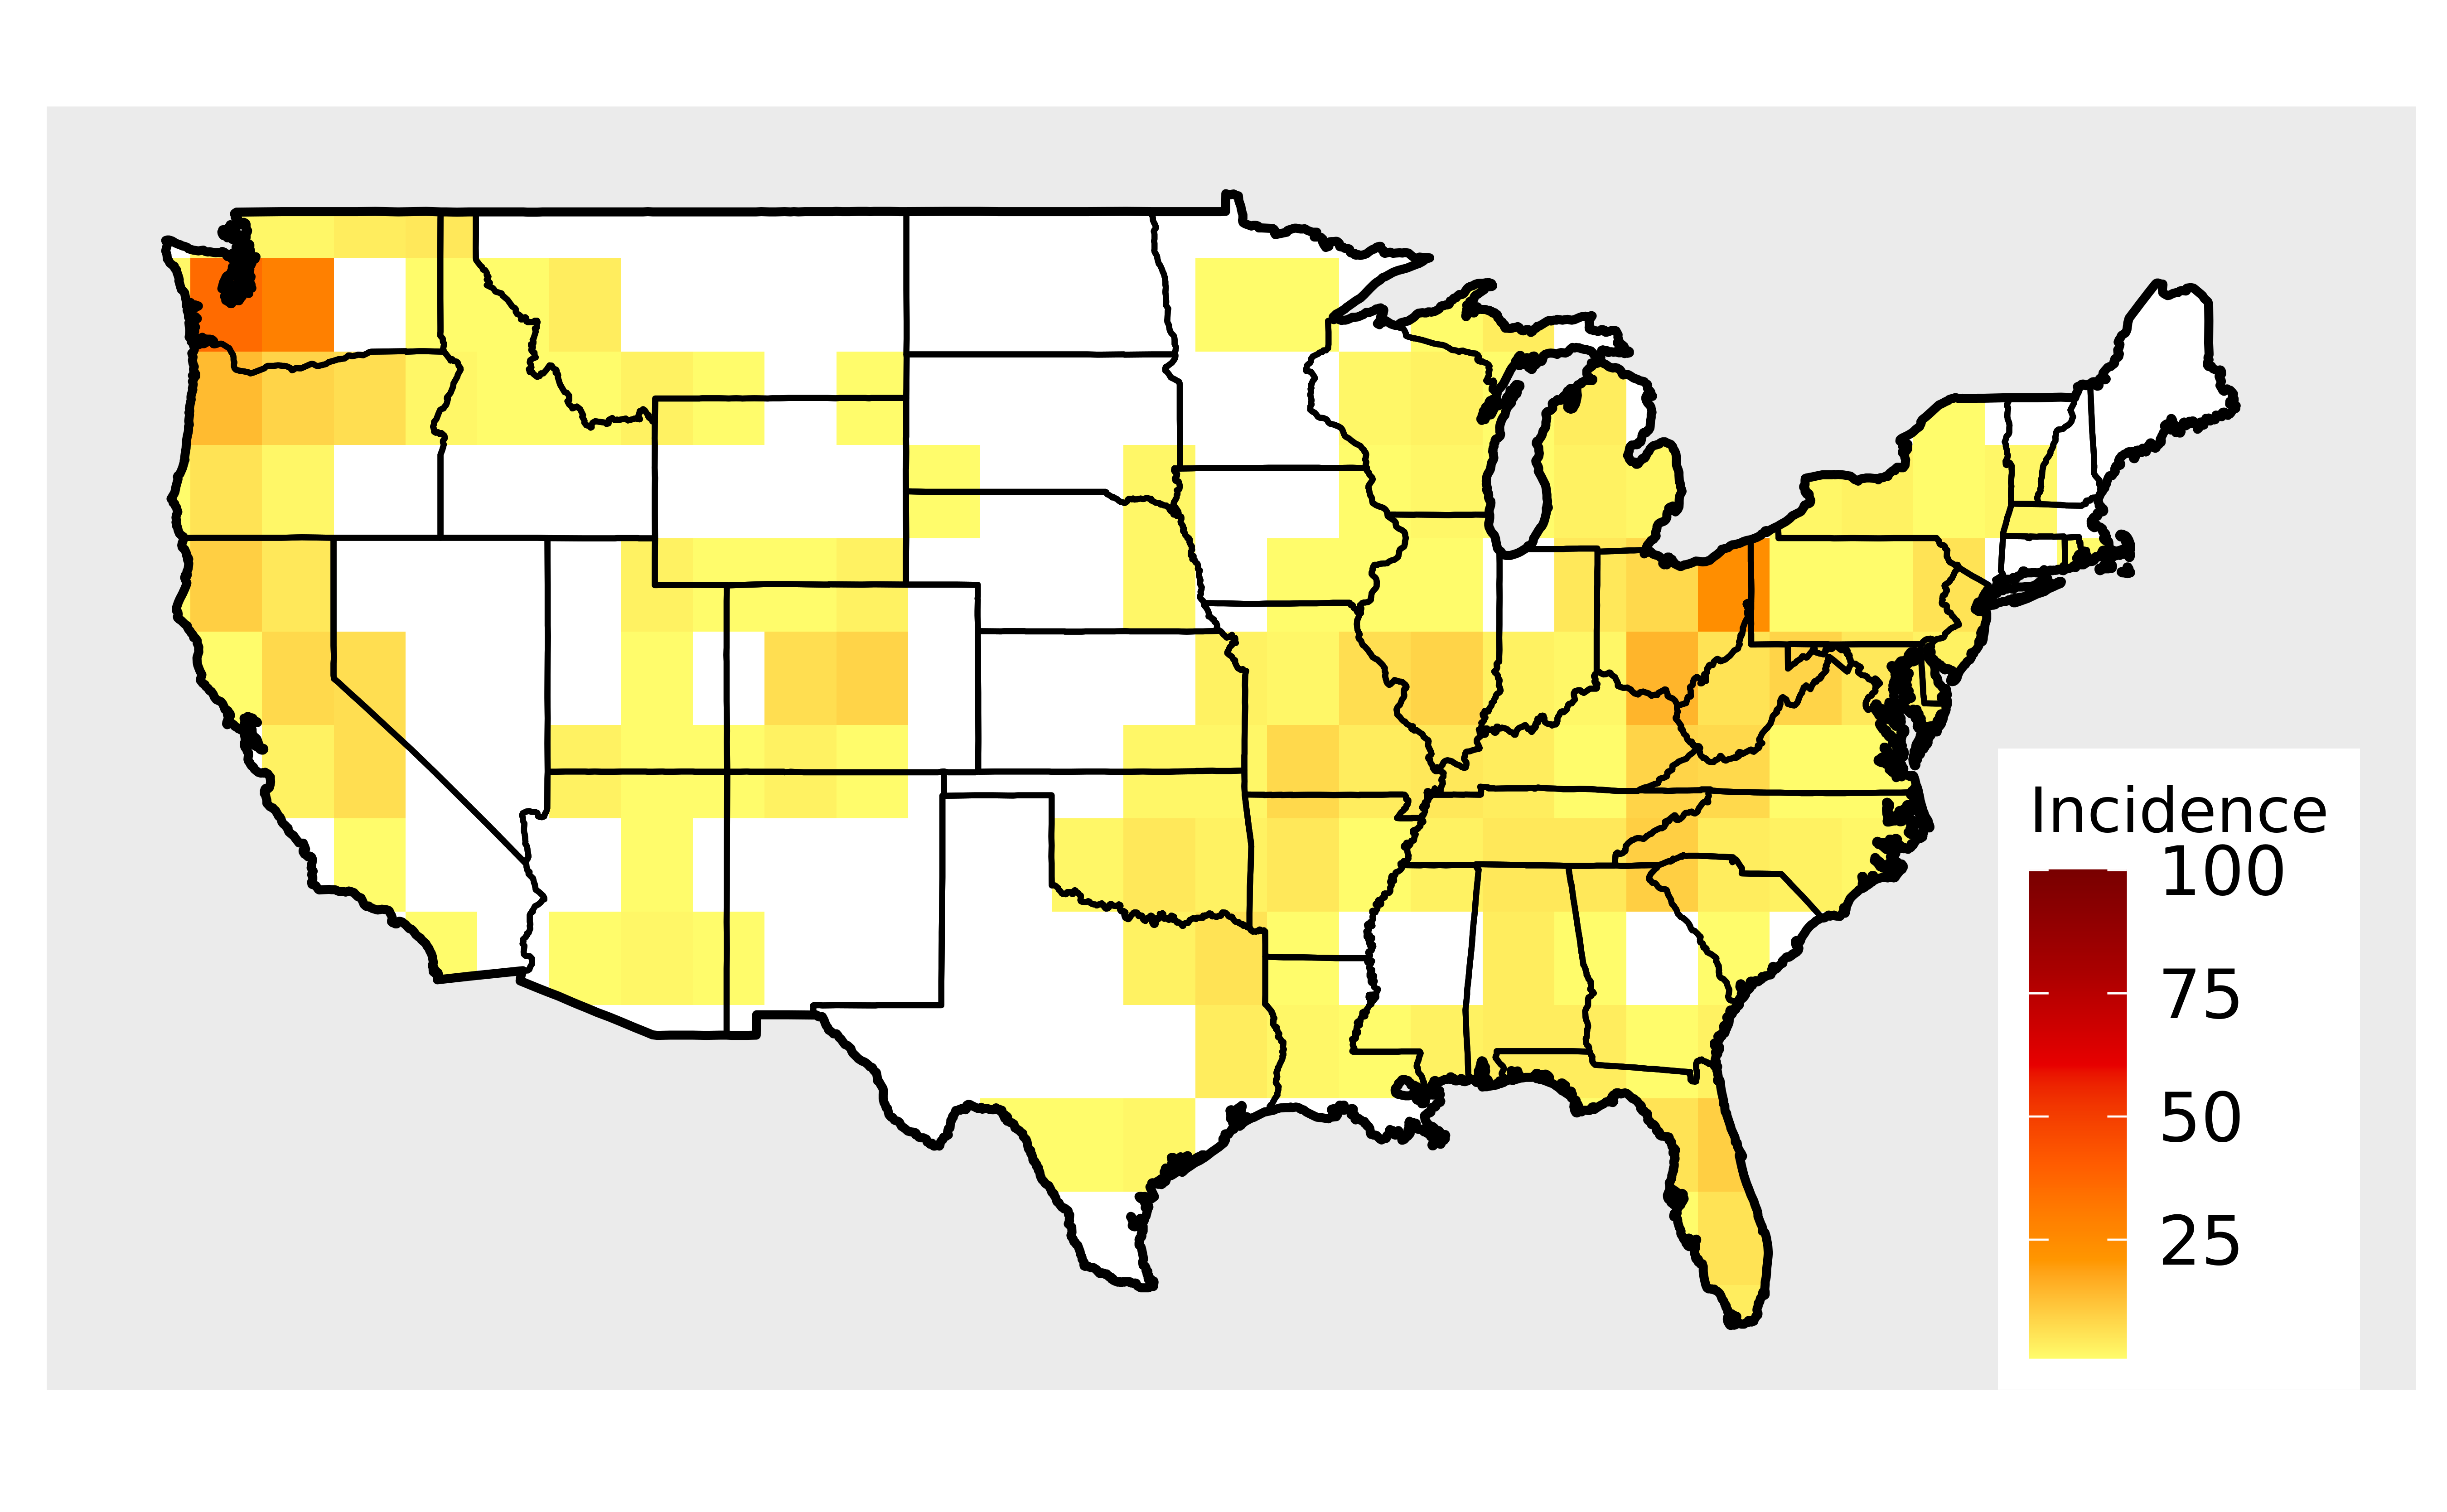
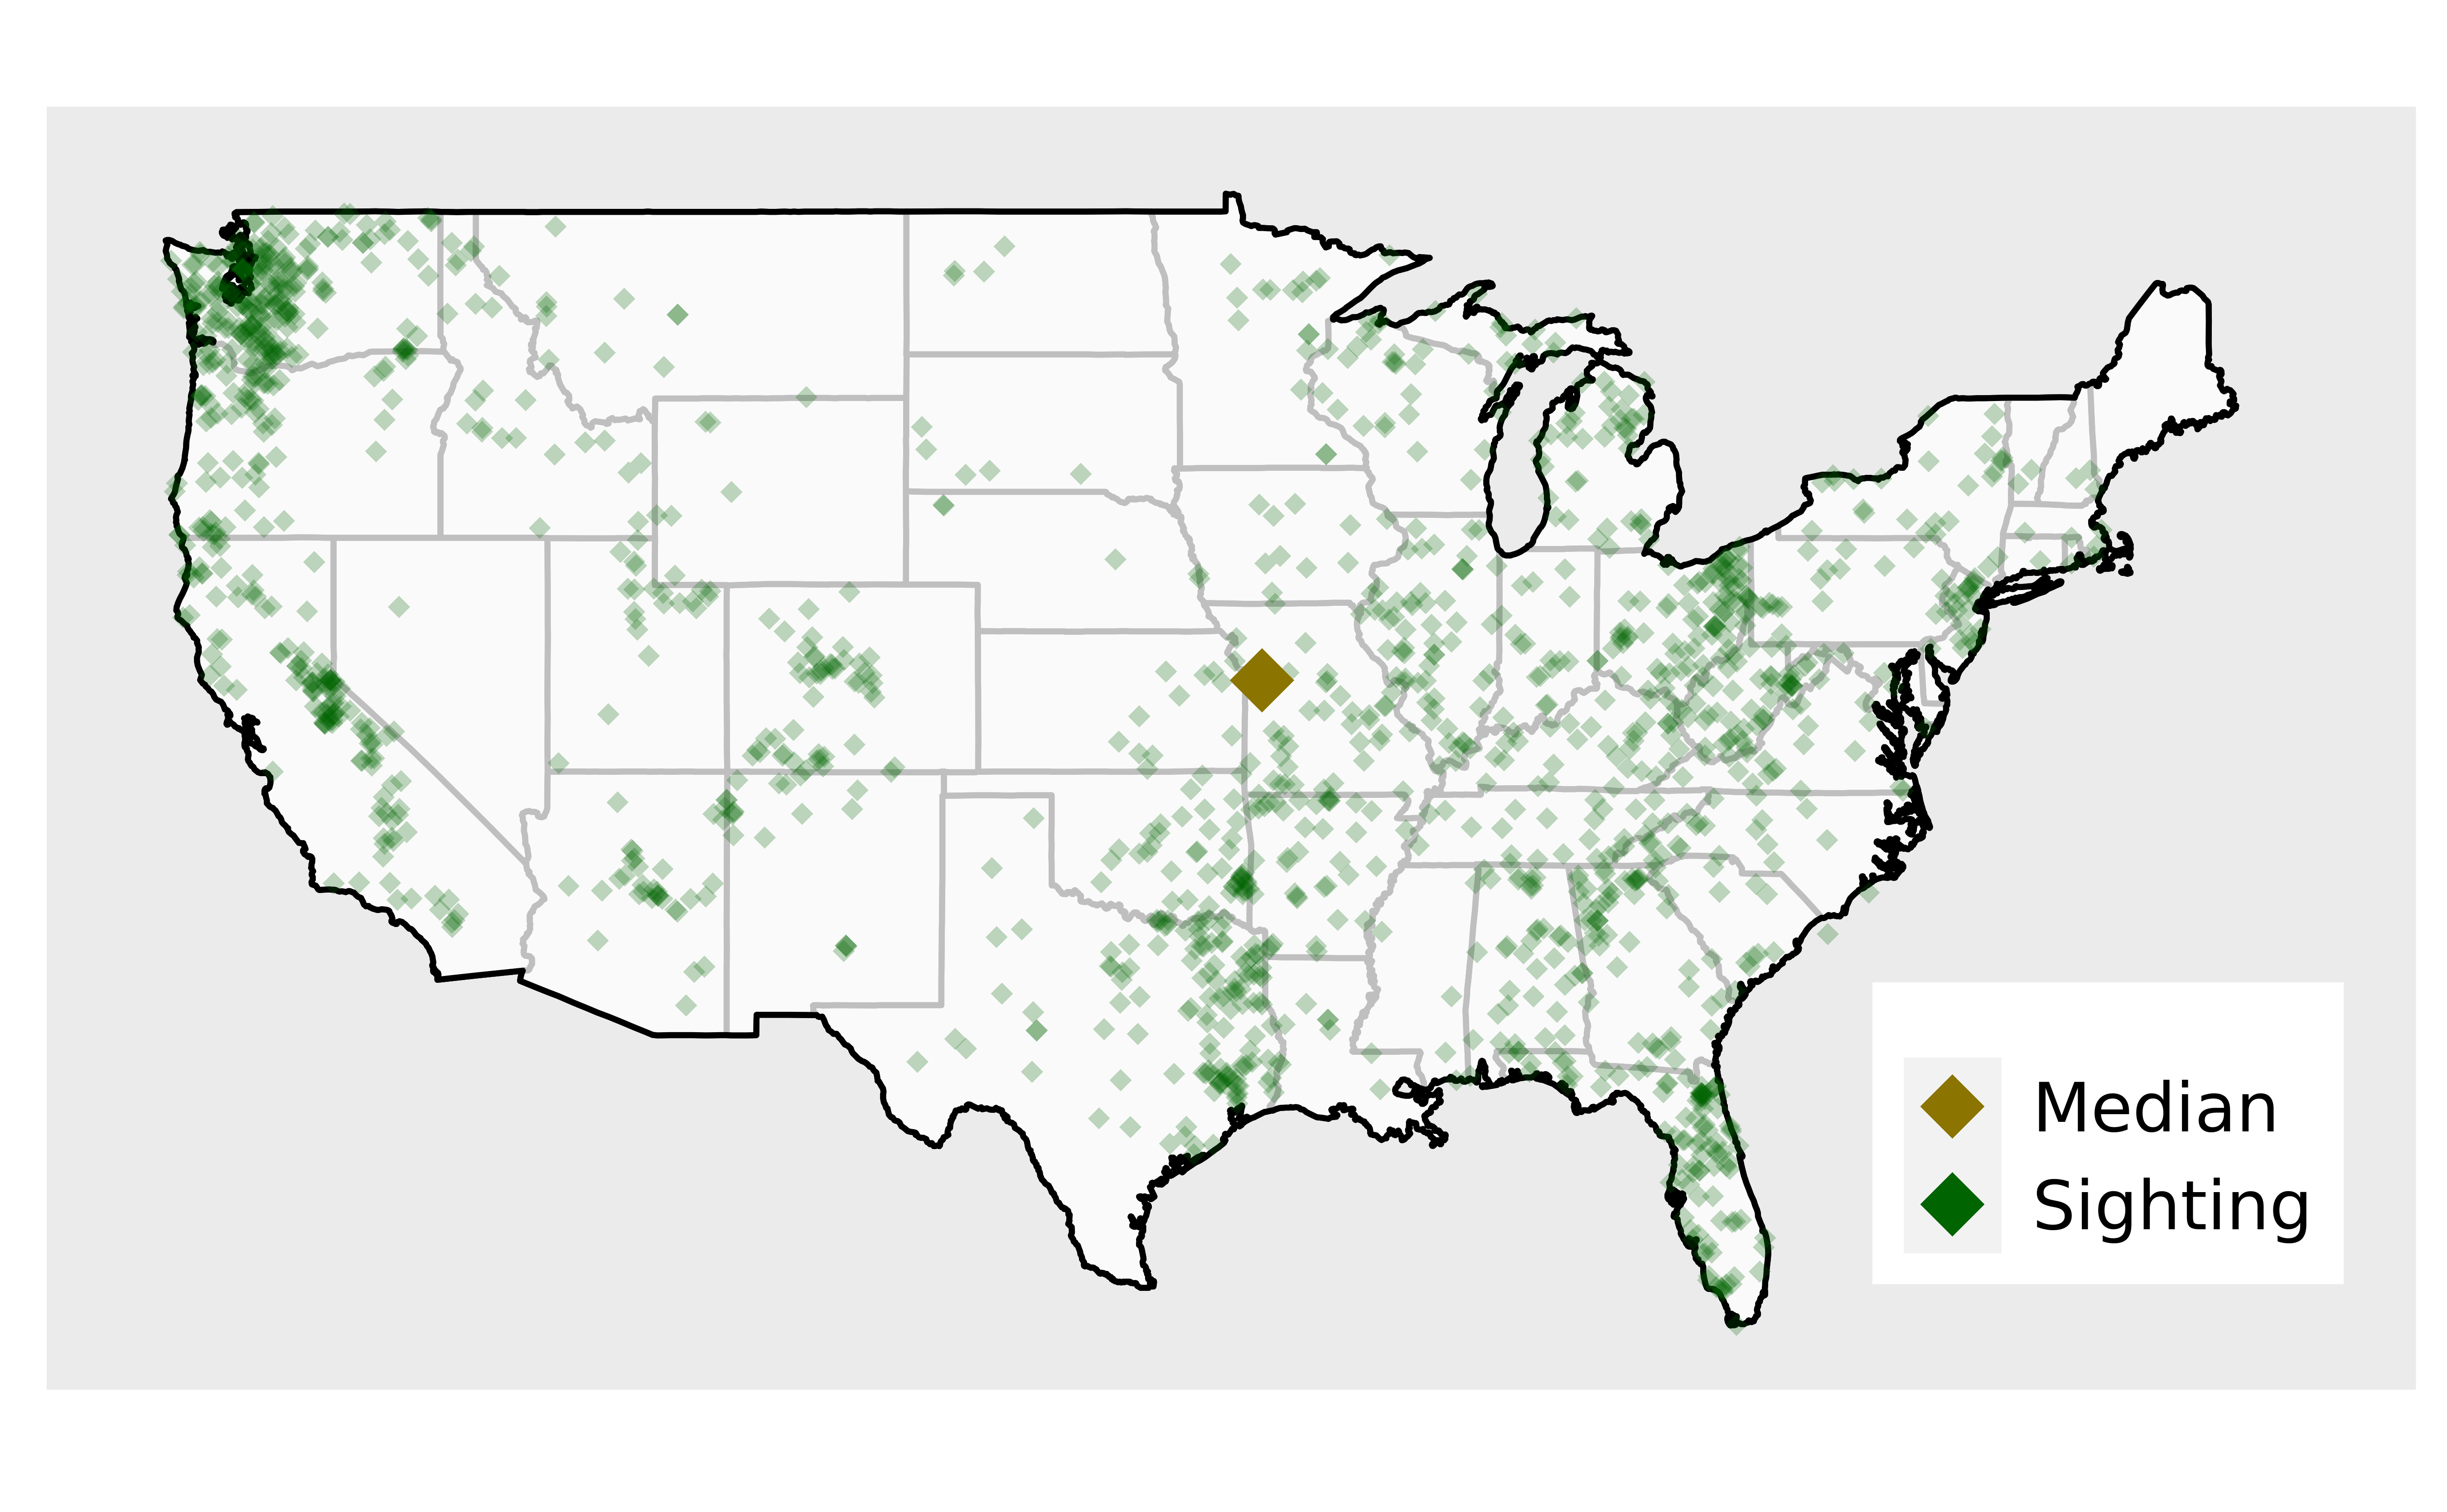
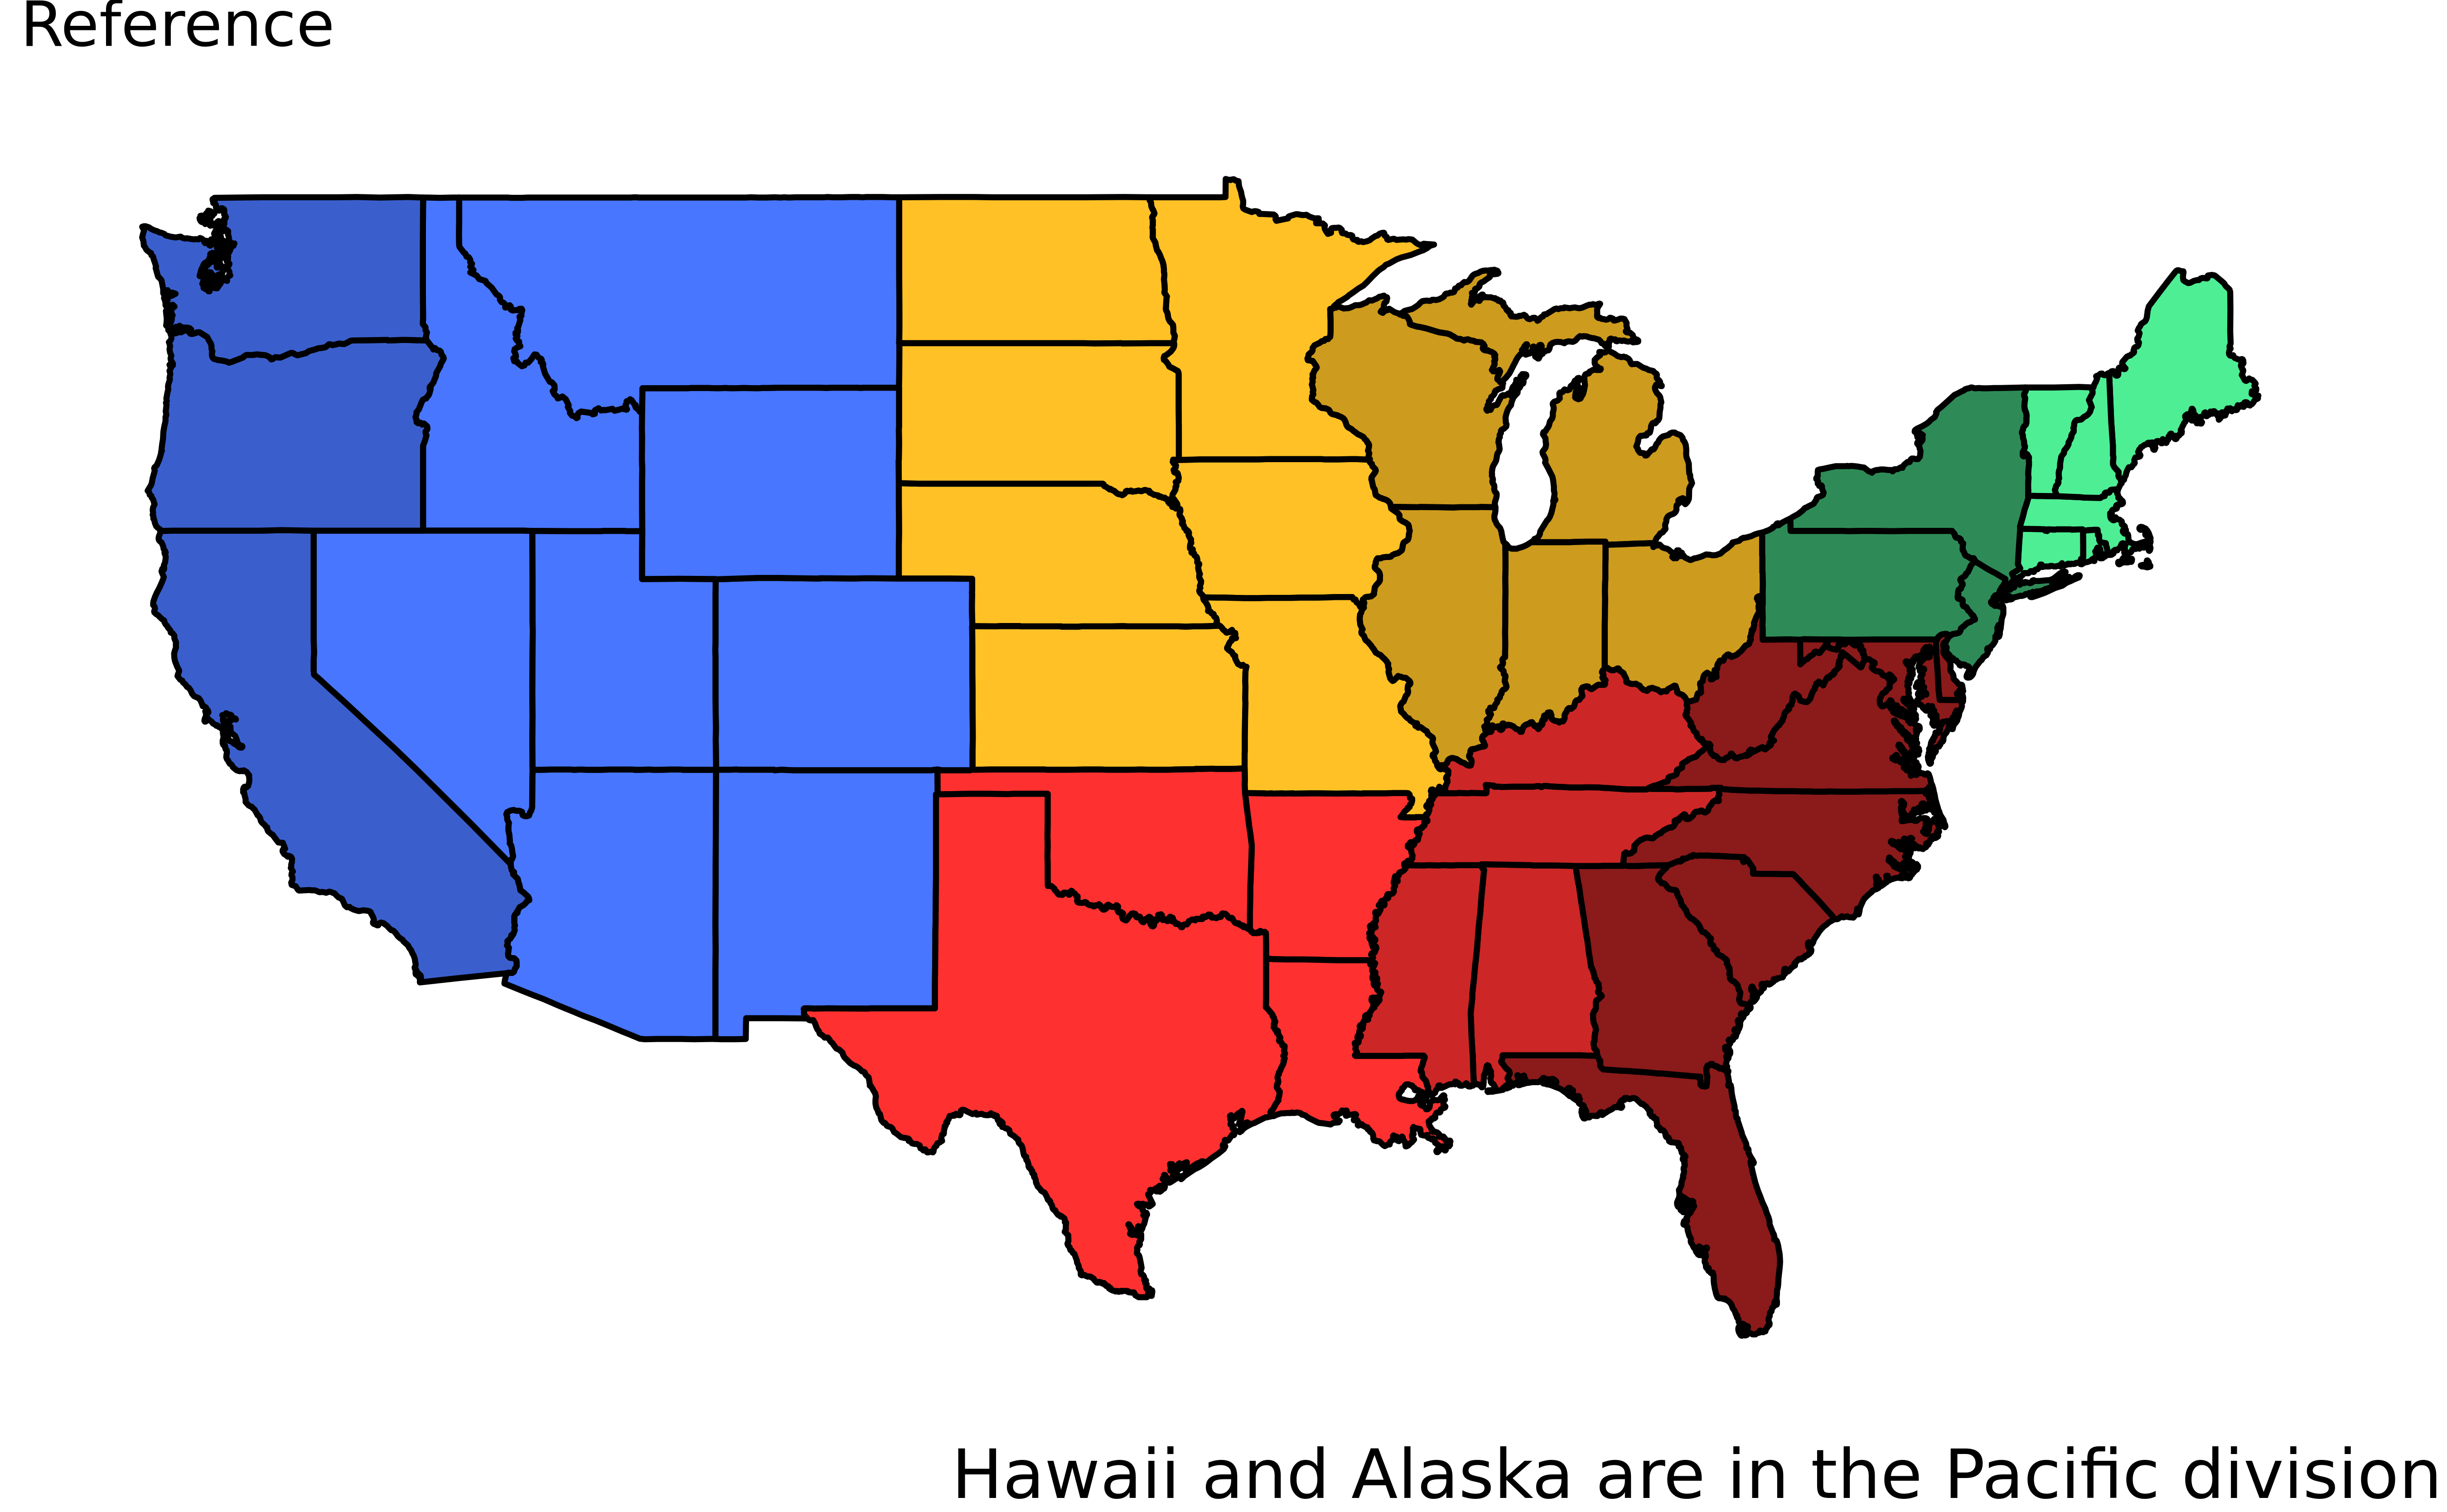
Data Source: Bigfoot Field Researchers Organization (BFRO), Dark Sky API
Dimensions: 5,021 rows (different Bigfoot sightings), 28 columns (details of sightings)
Non-Weather Variables (12)
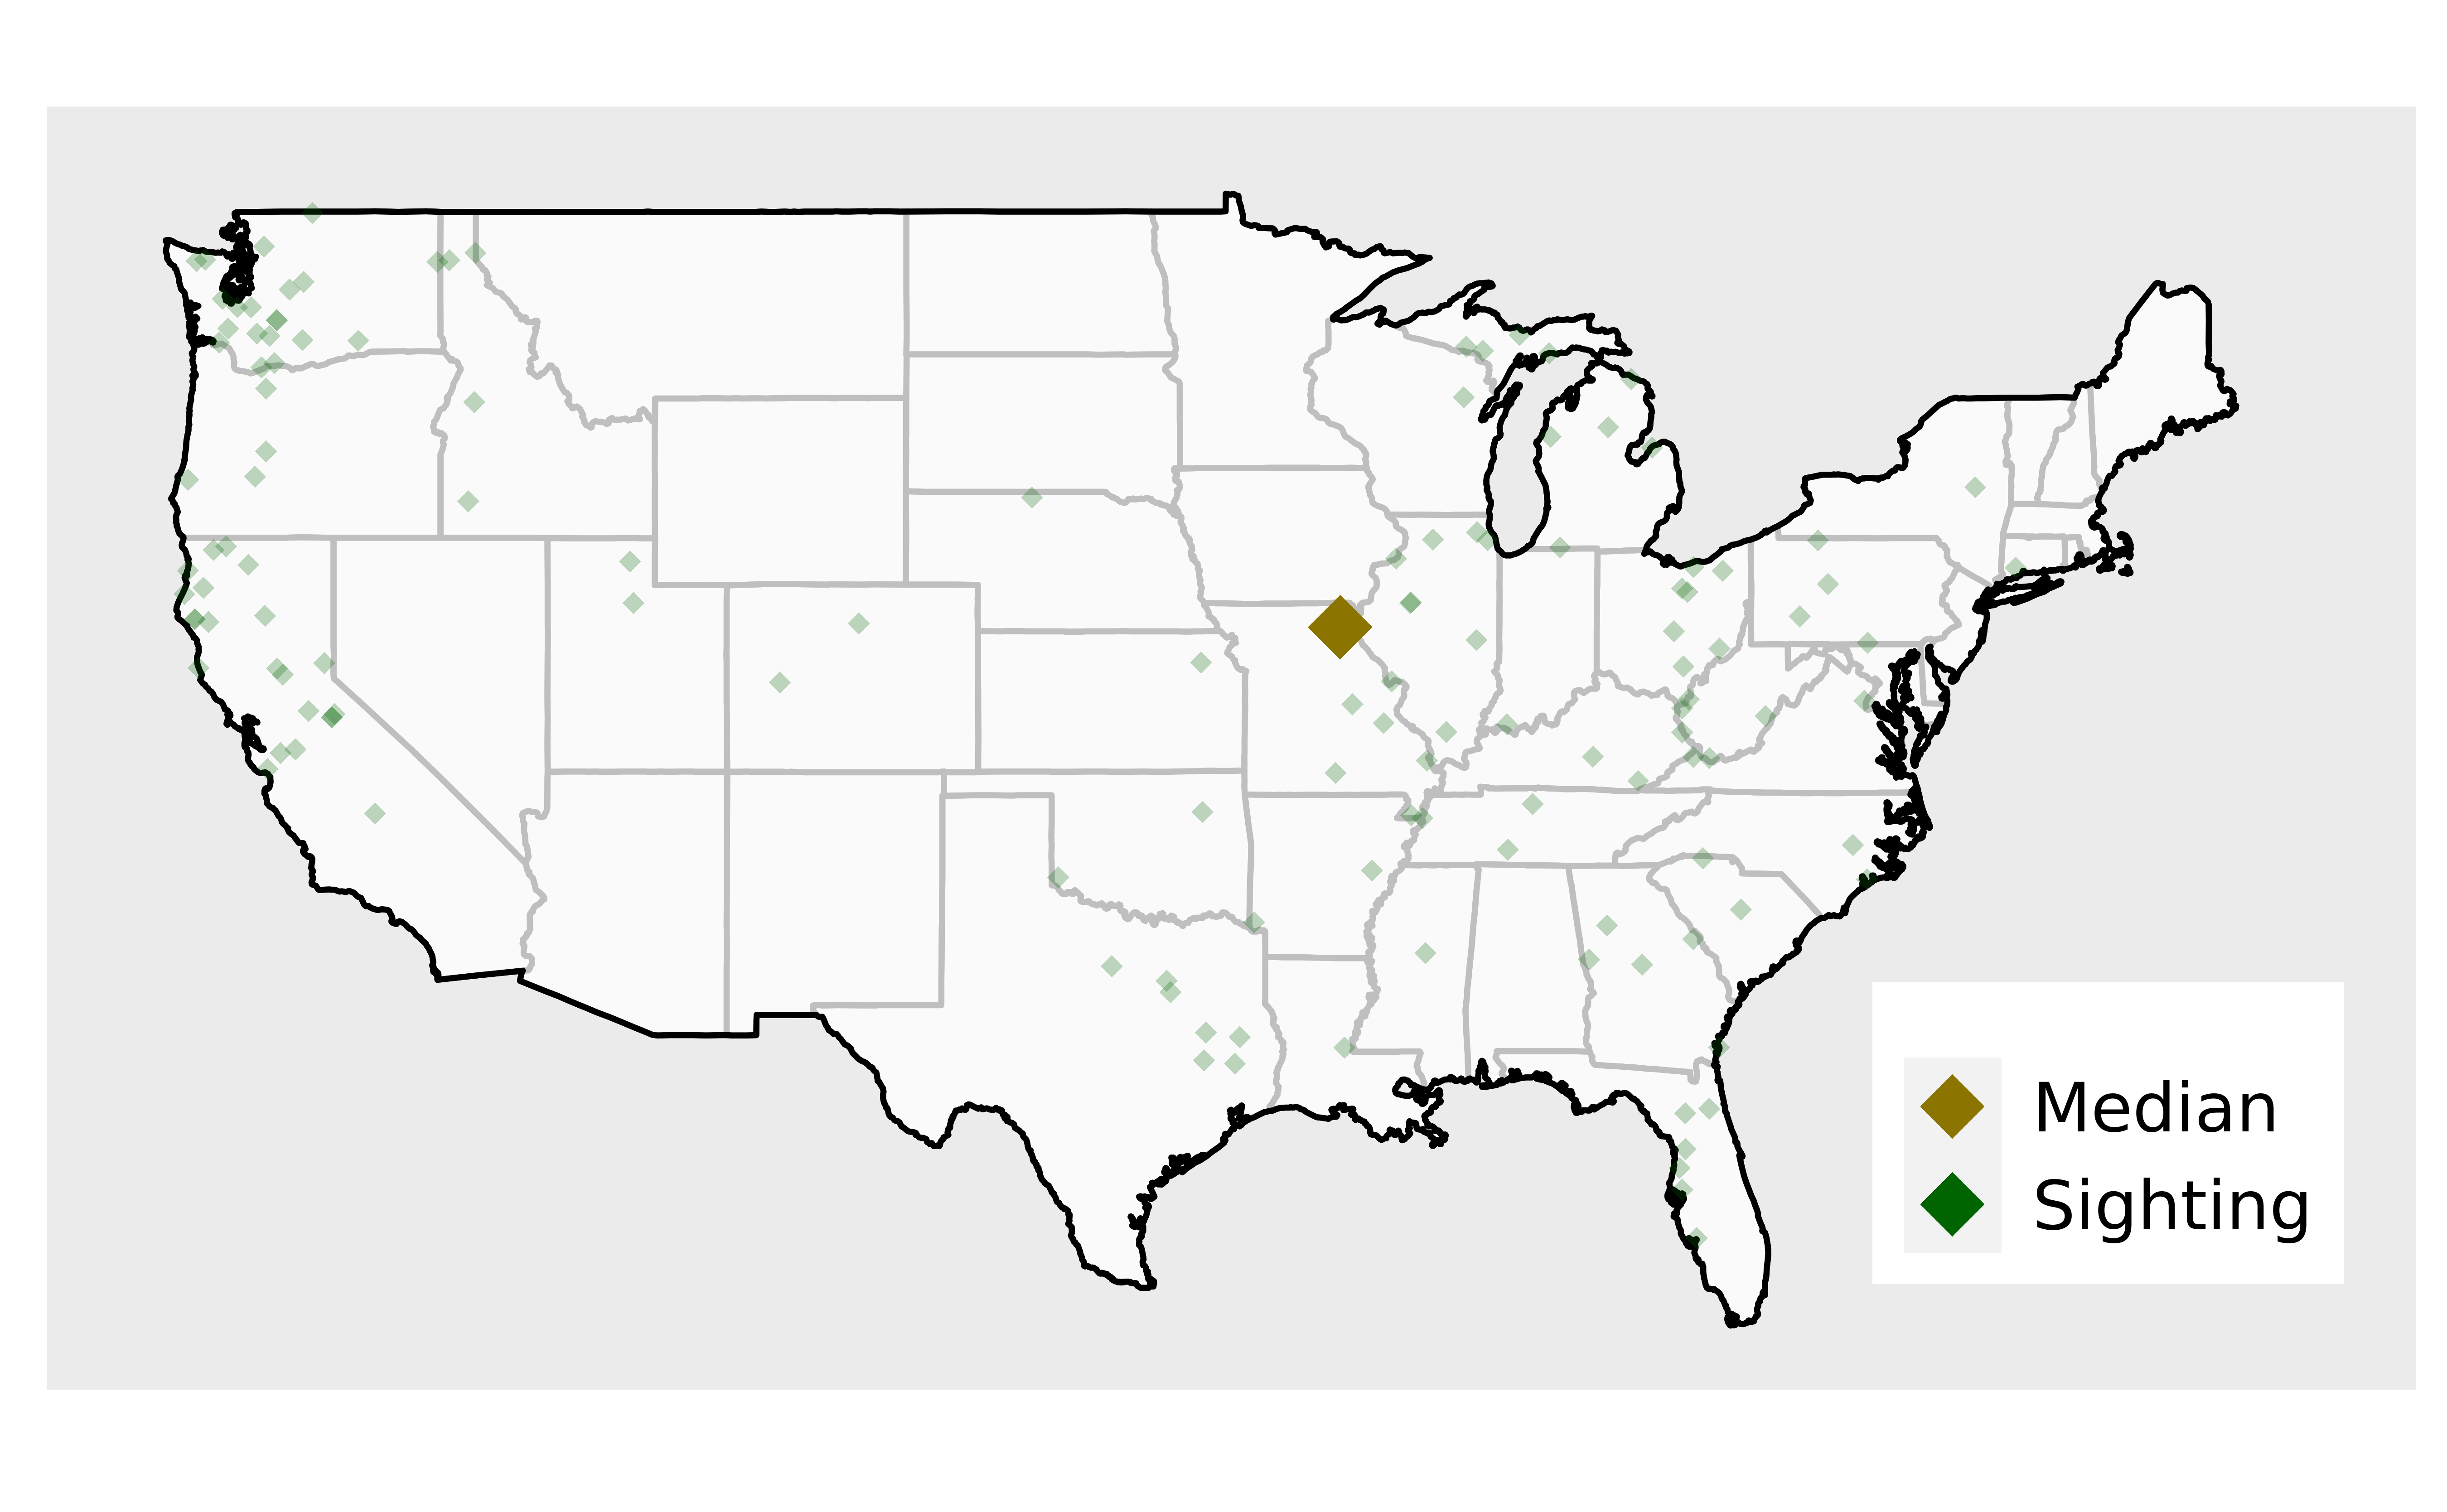
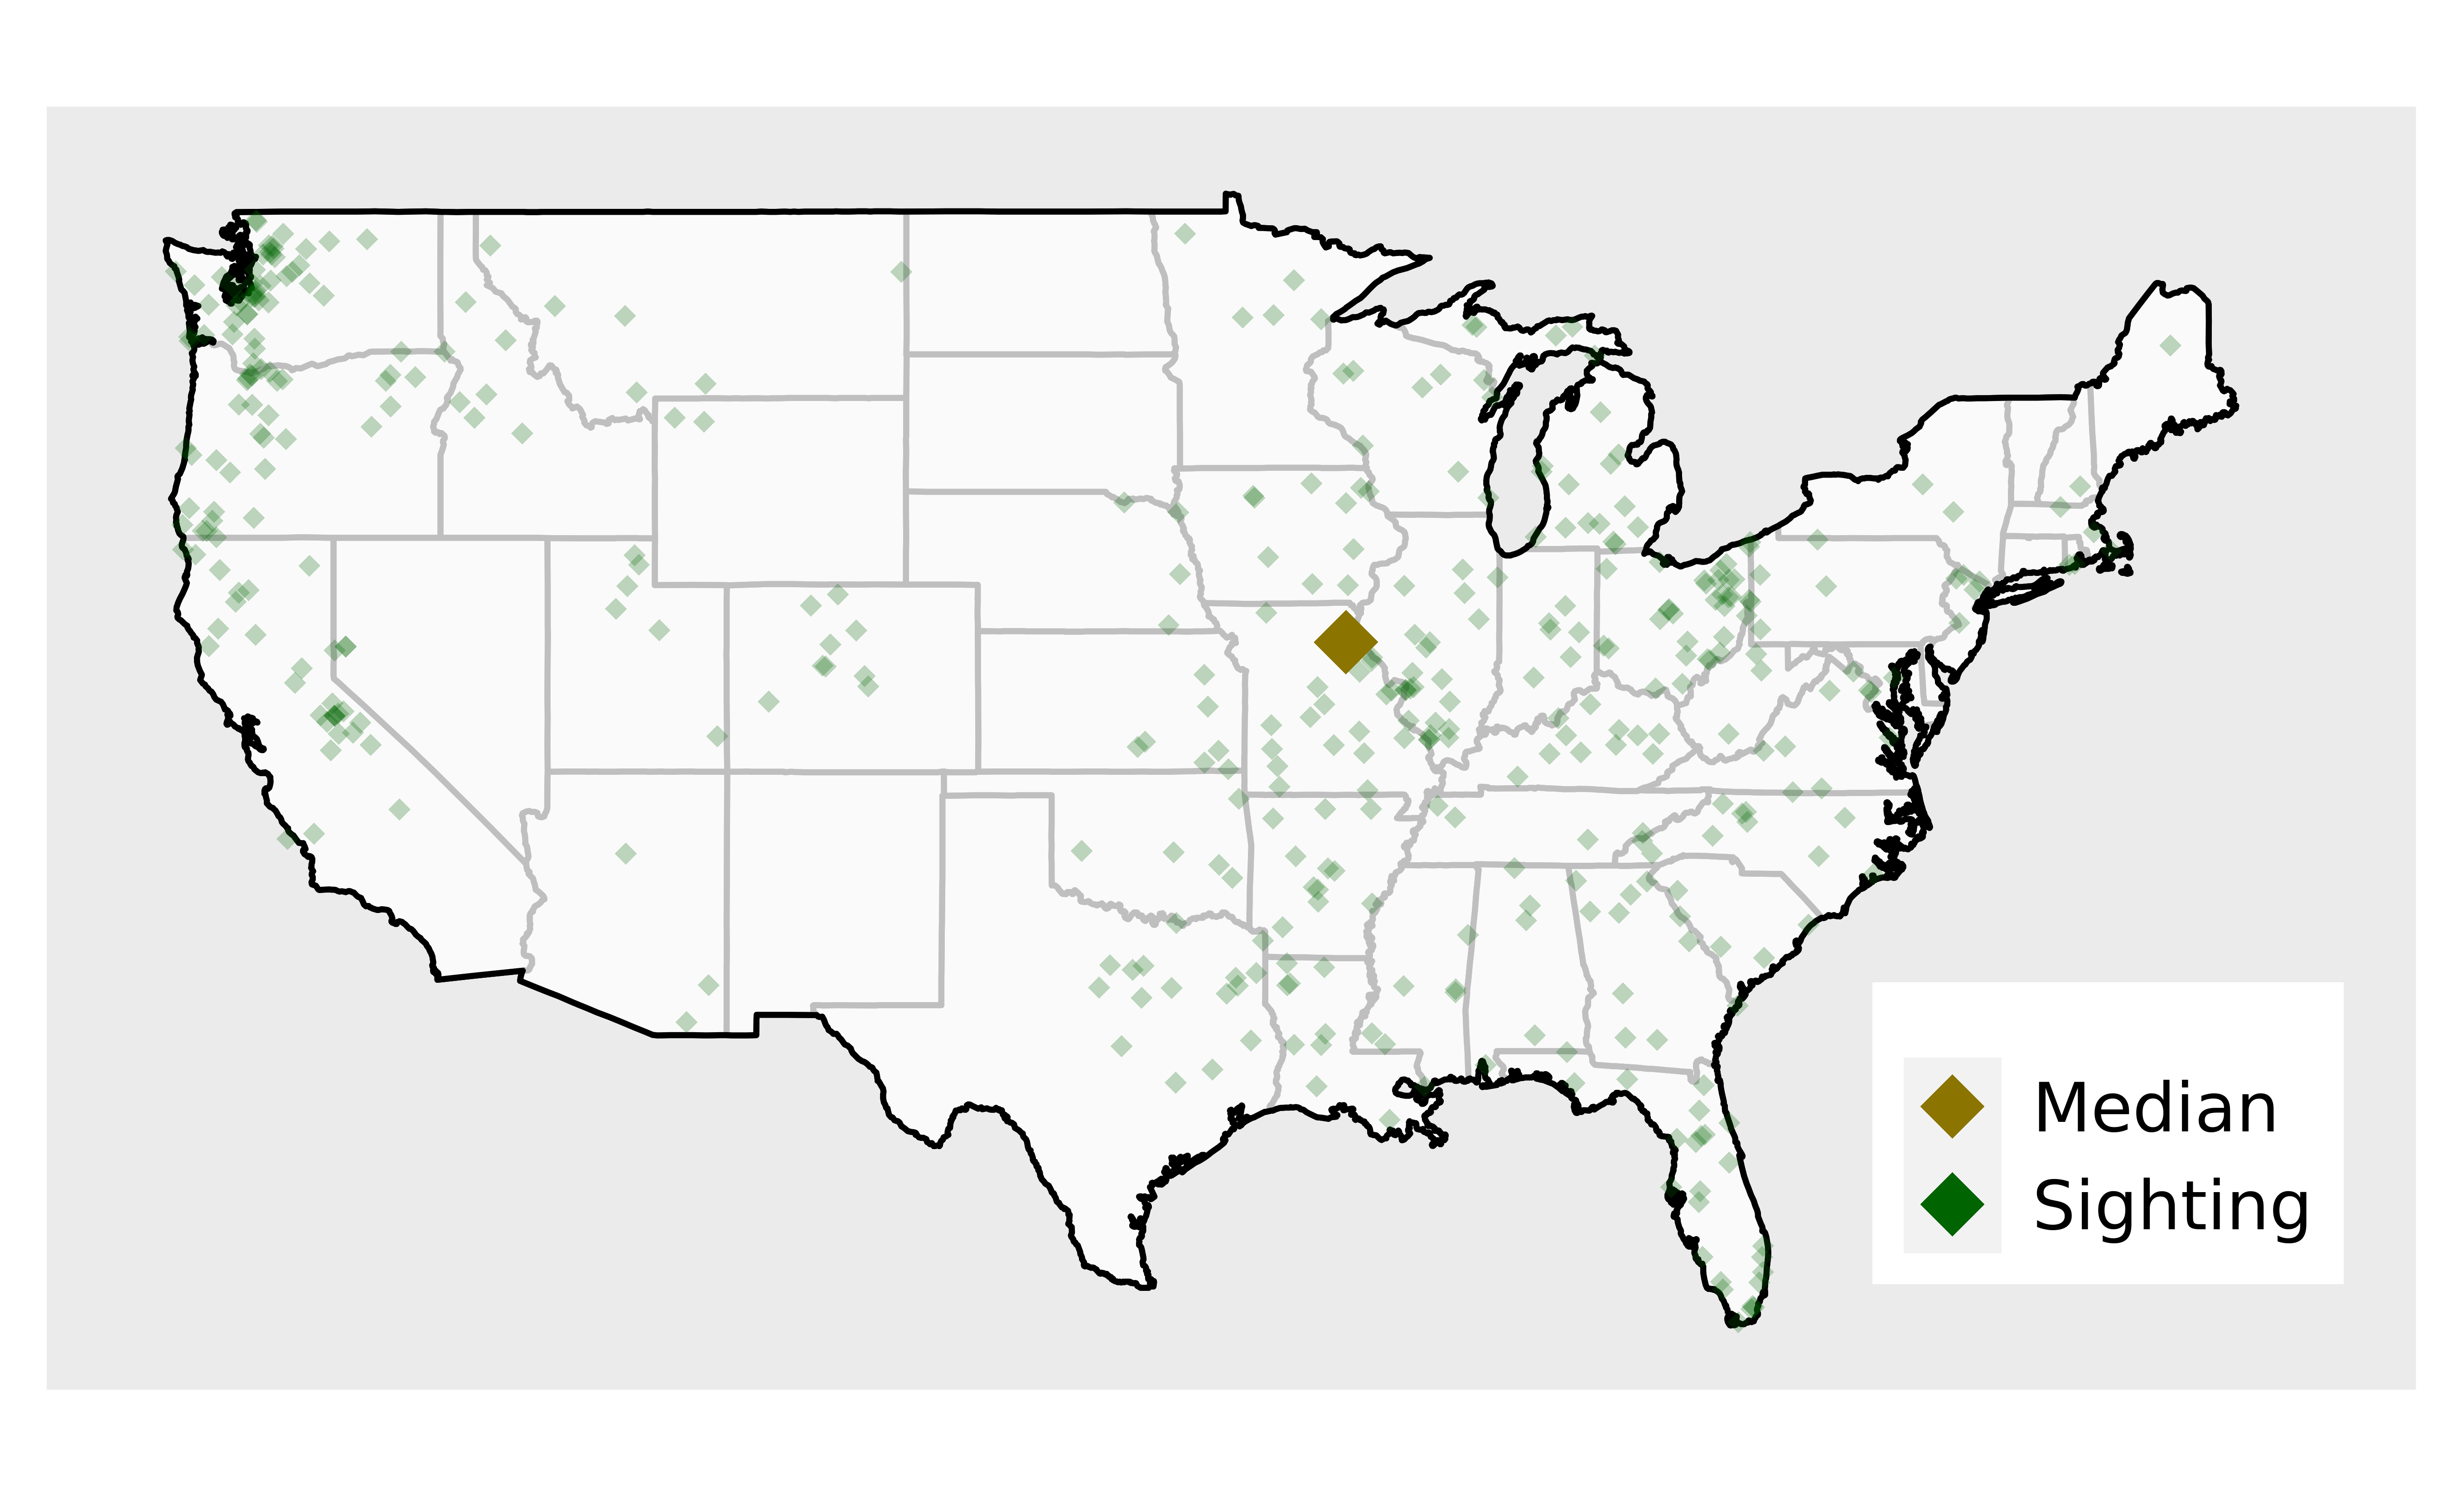
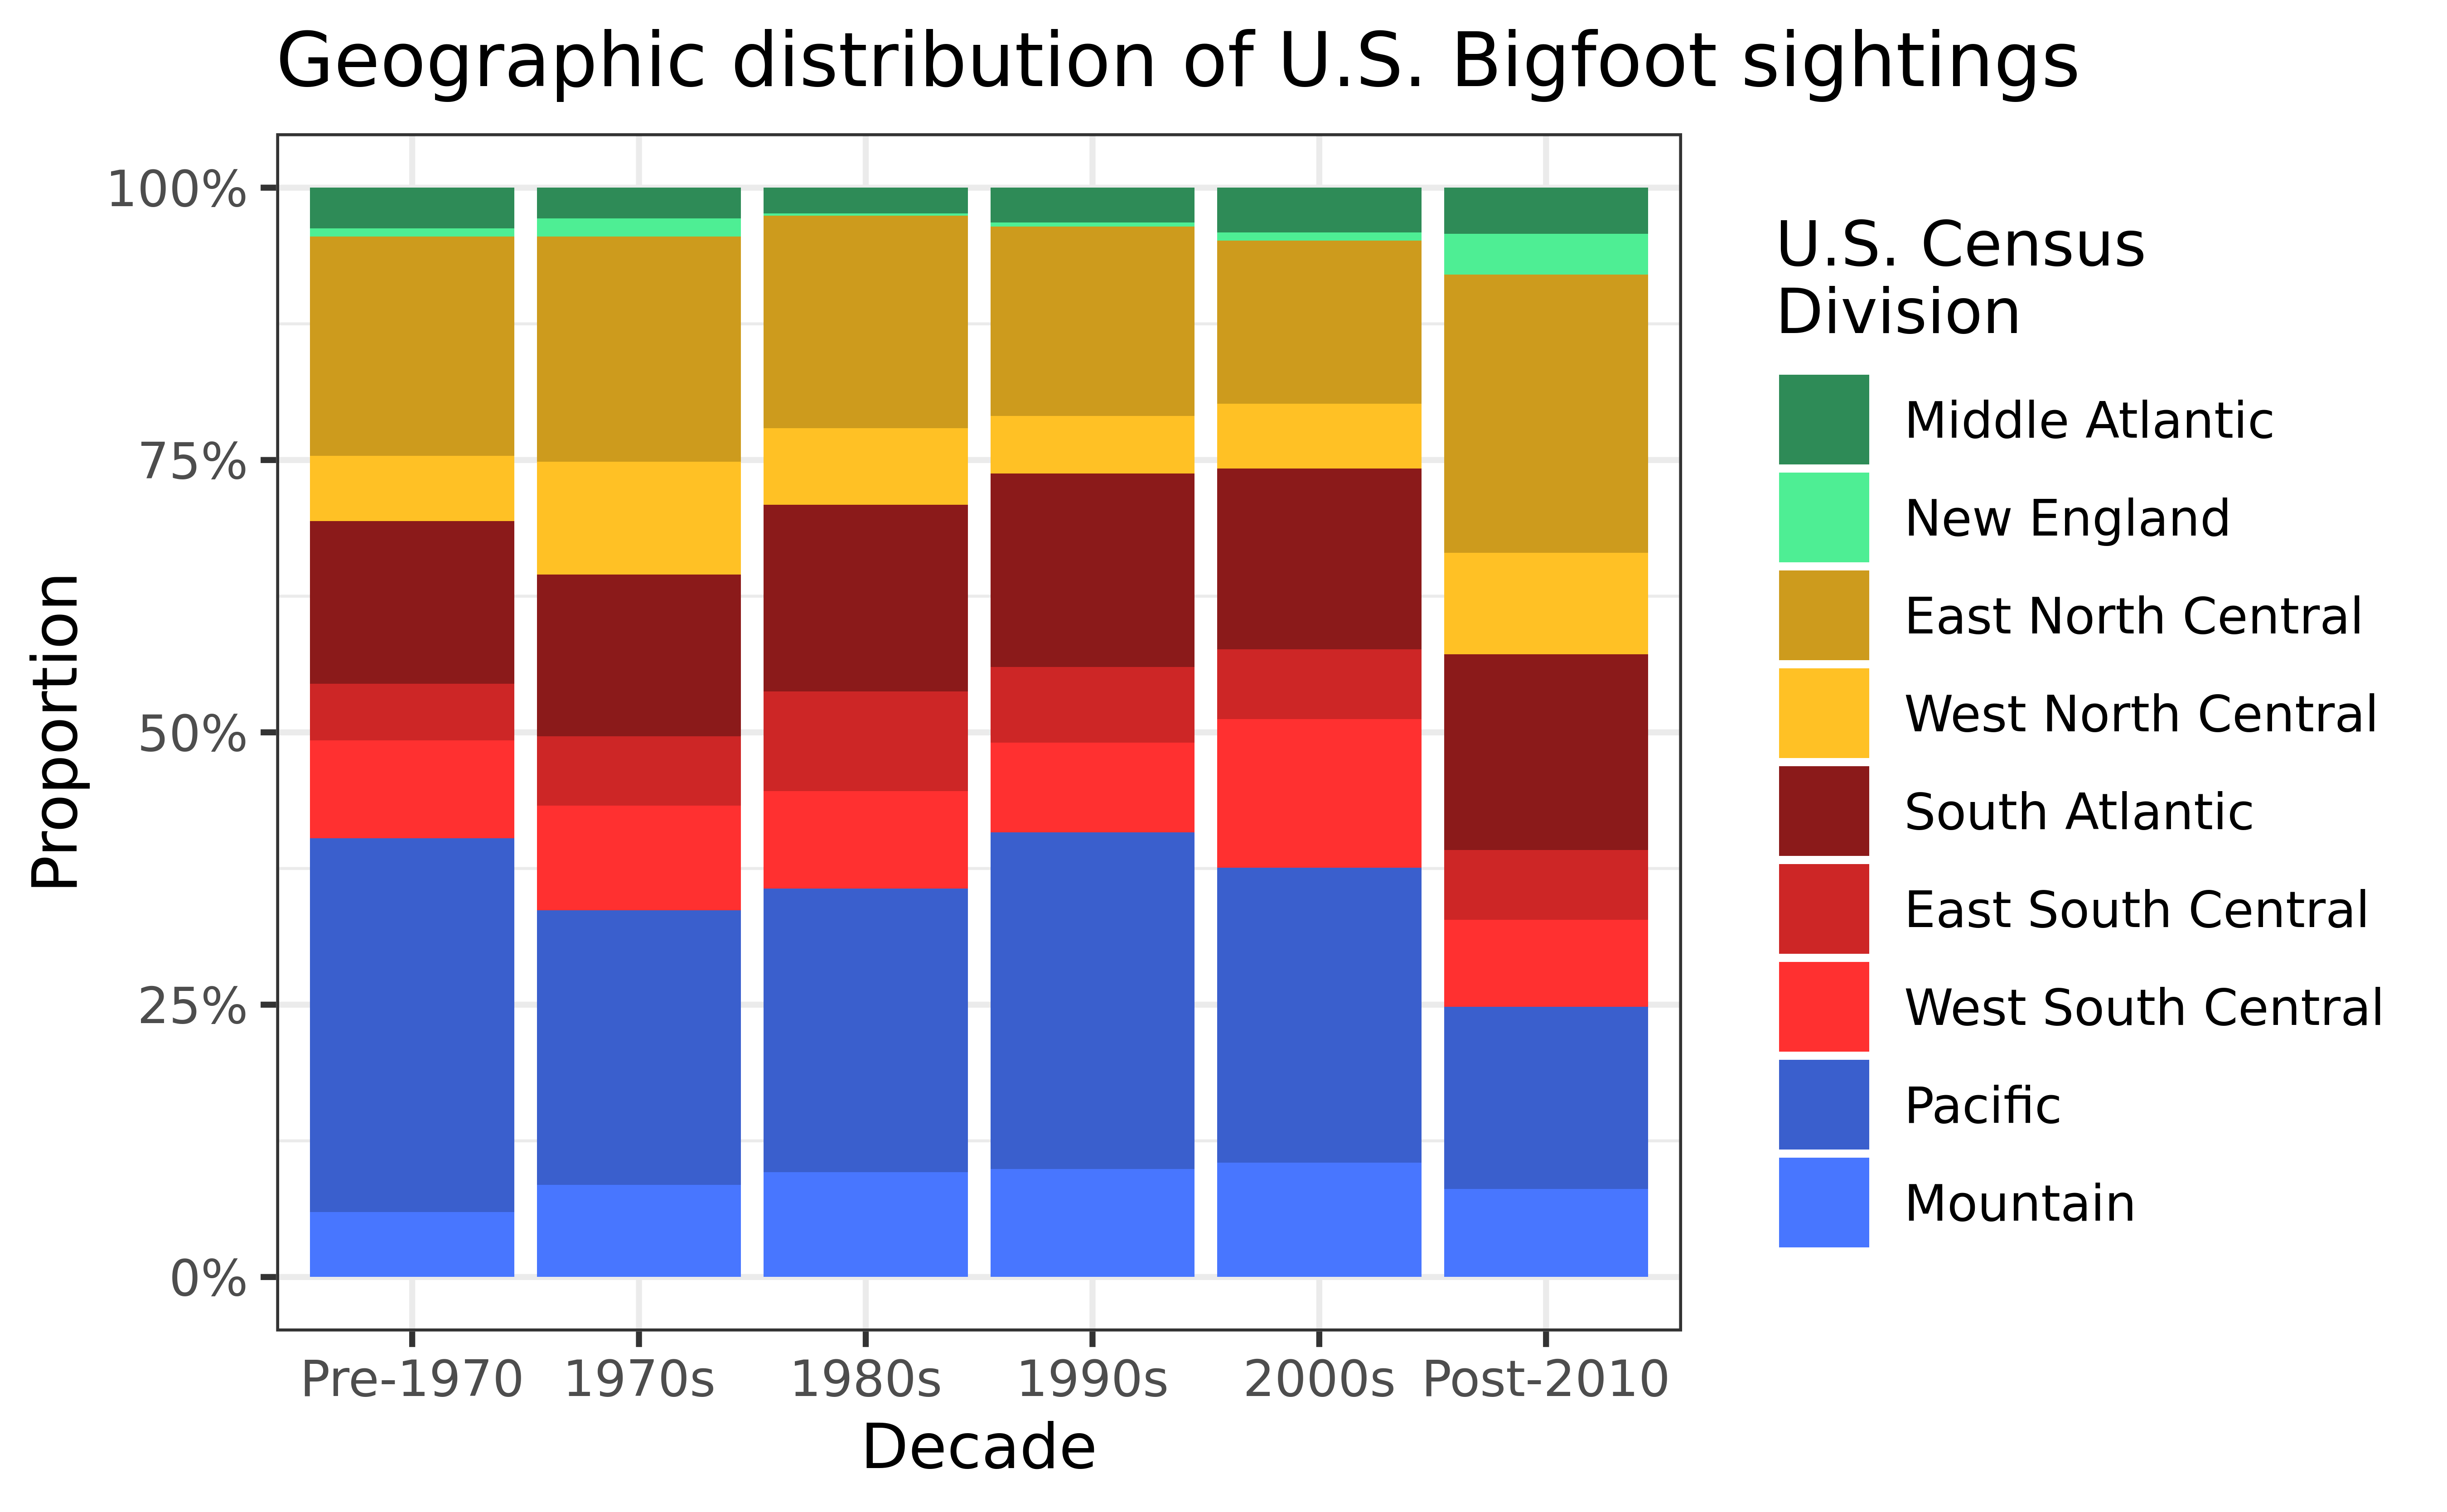
observed, location_details, county, state, season, title, latitude, longitude, date, number, classification, geohash
Weather Variables (16)
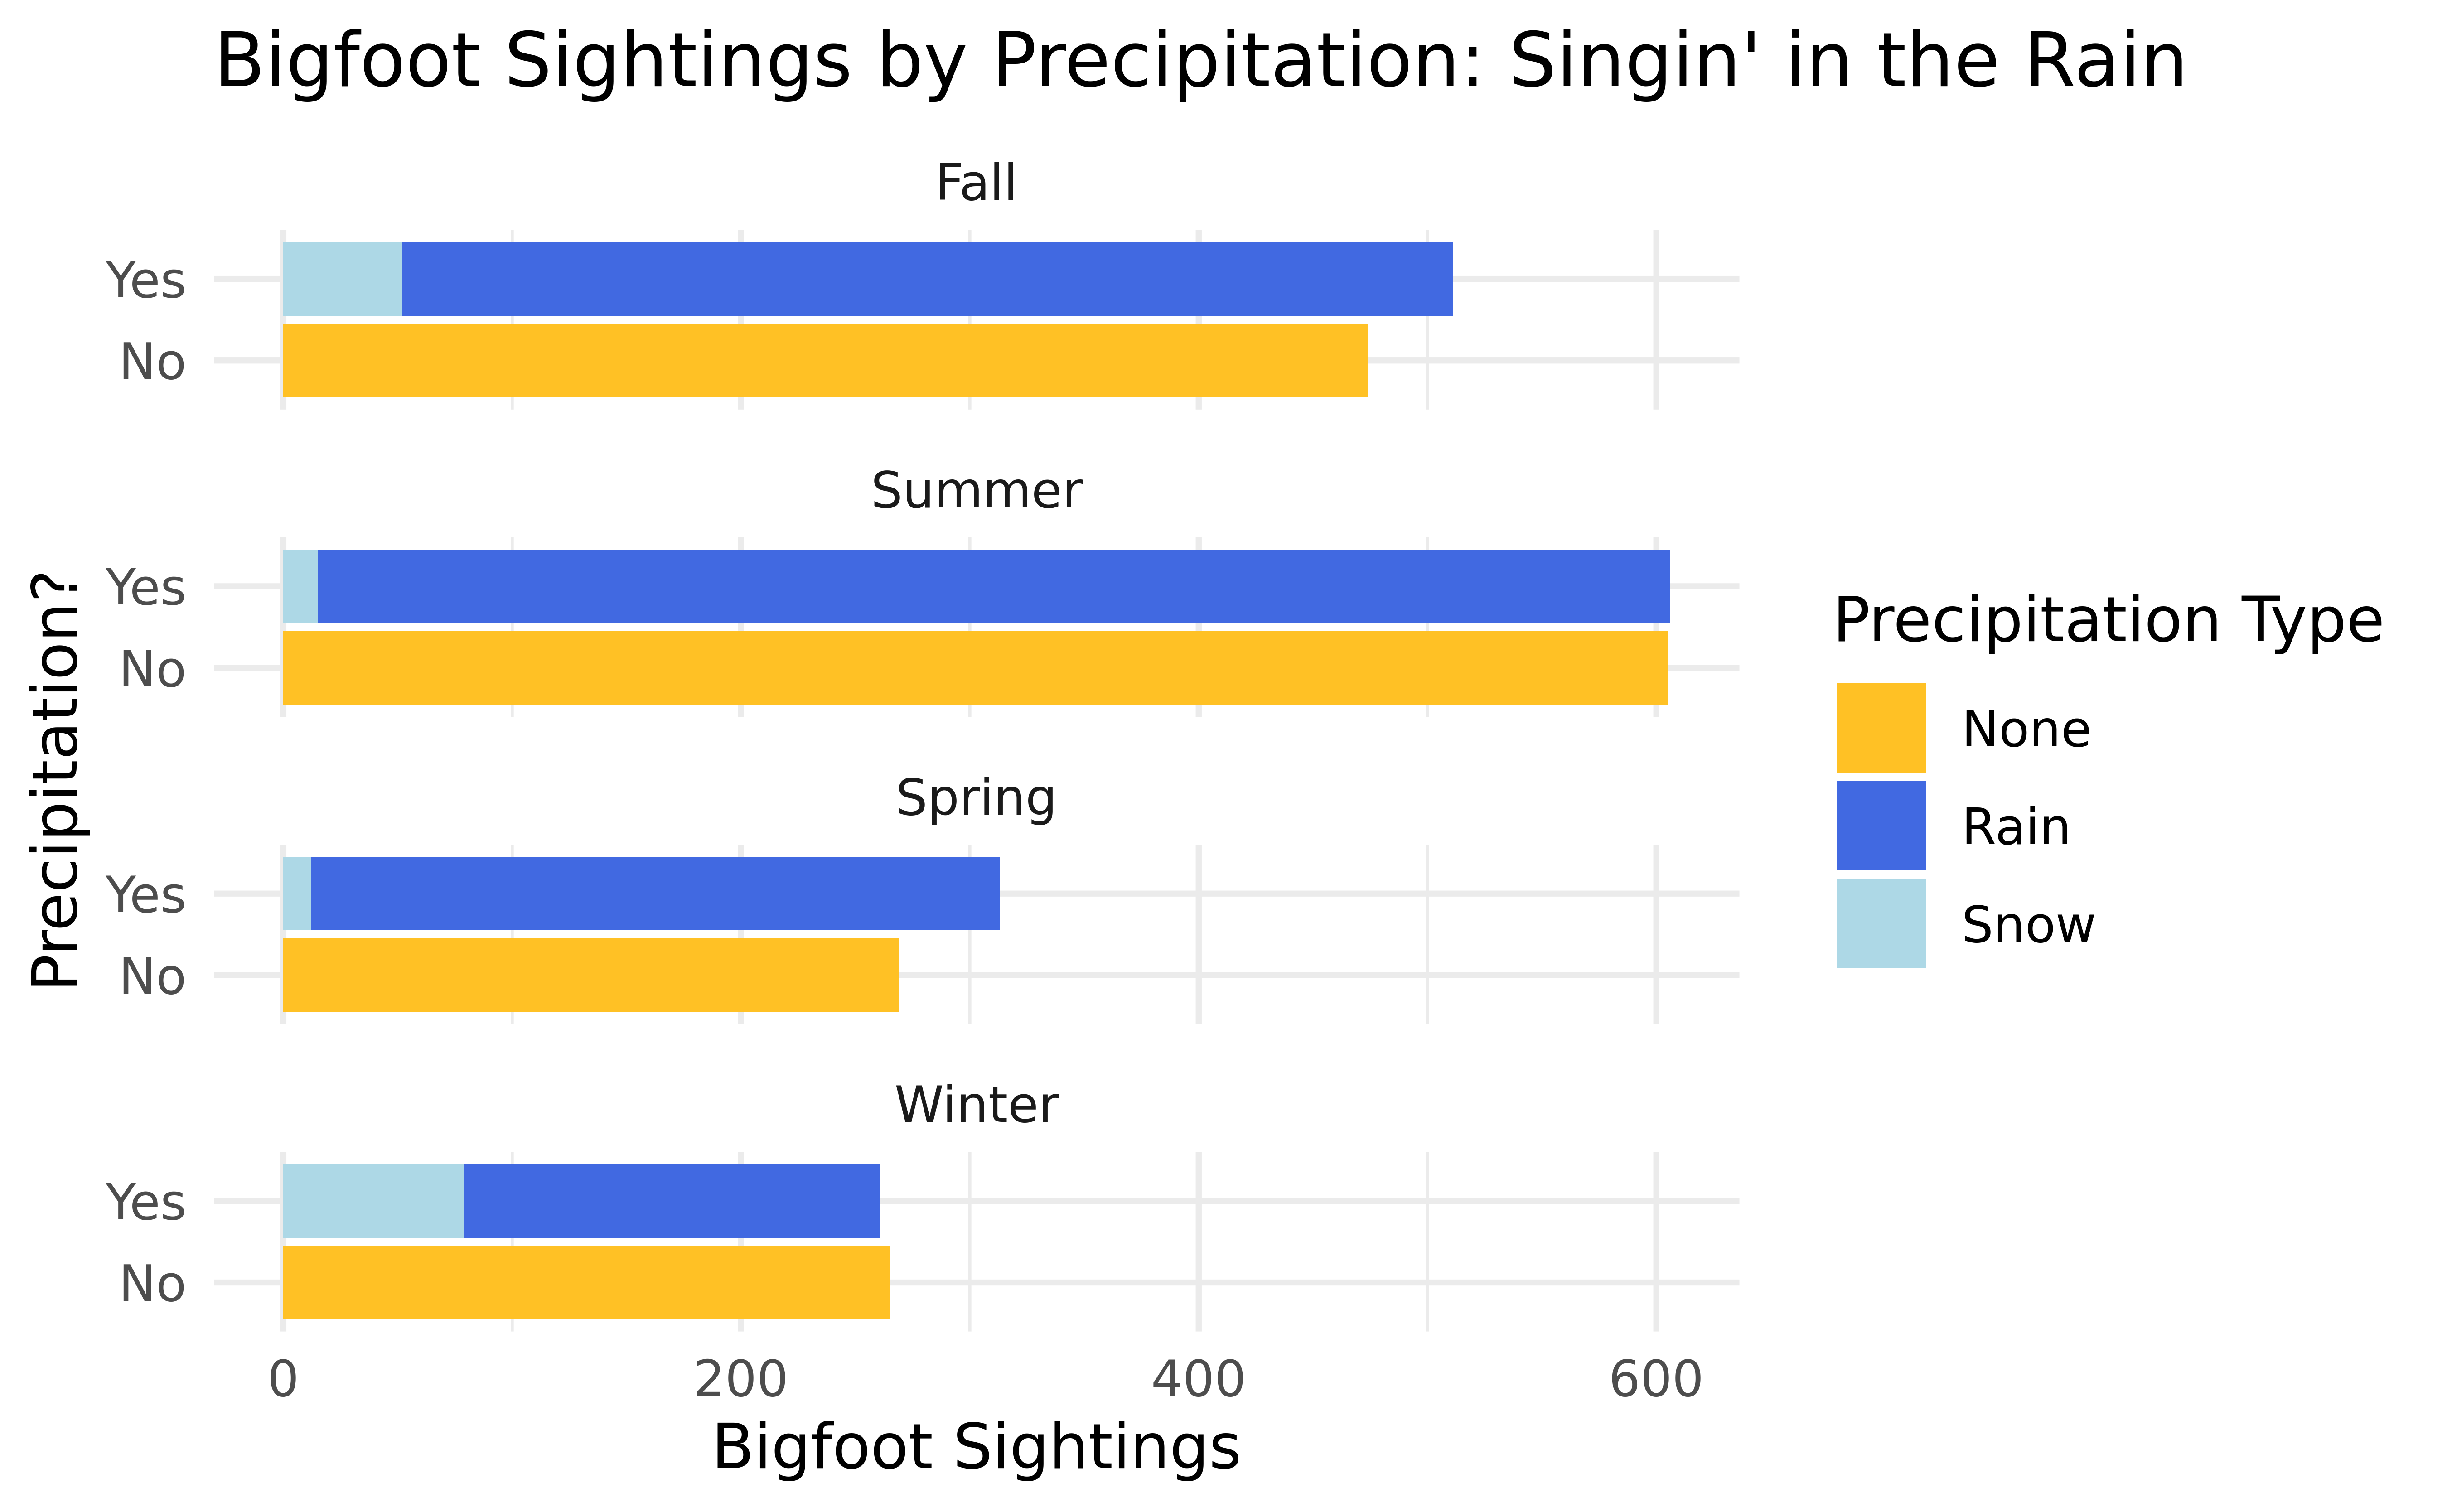
temperature_high, temperature_mid, temperature_low, dew_point, humidity, cloud_cover, moon_phase, precip_intensity, precip_probability, precip_type, pressure, summary, uv_index, visibility, wind_bearing, wind_speed
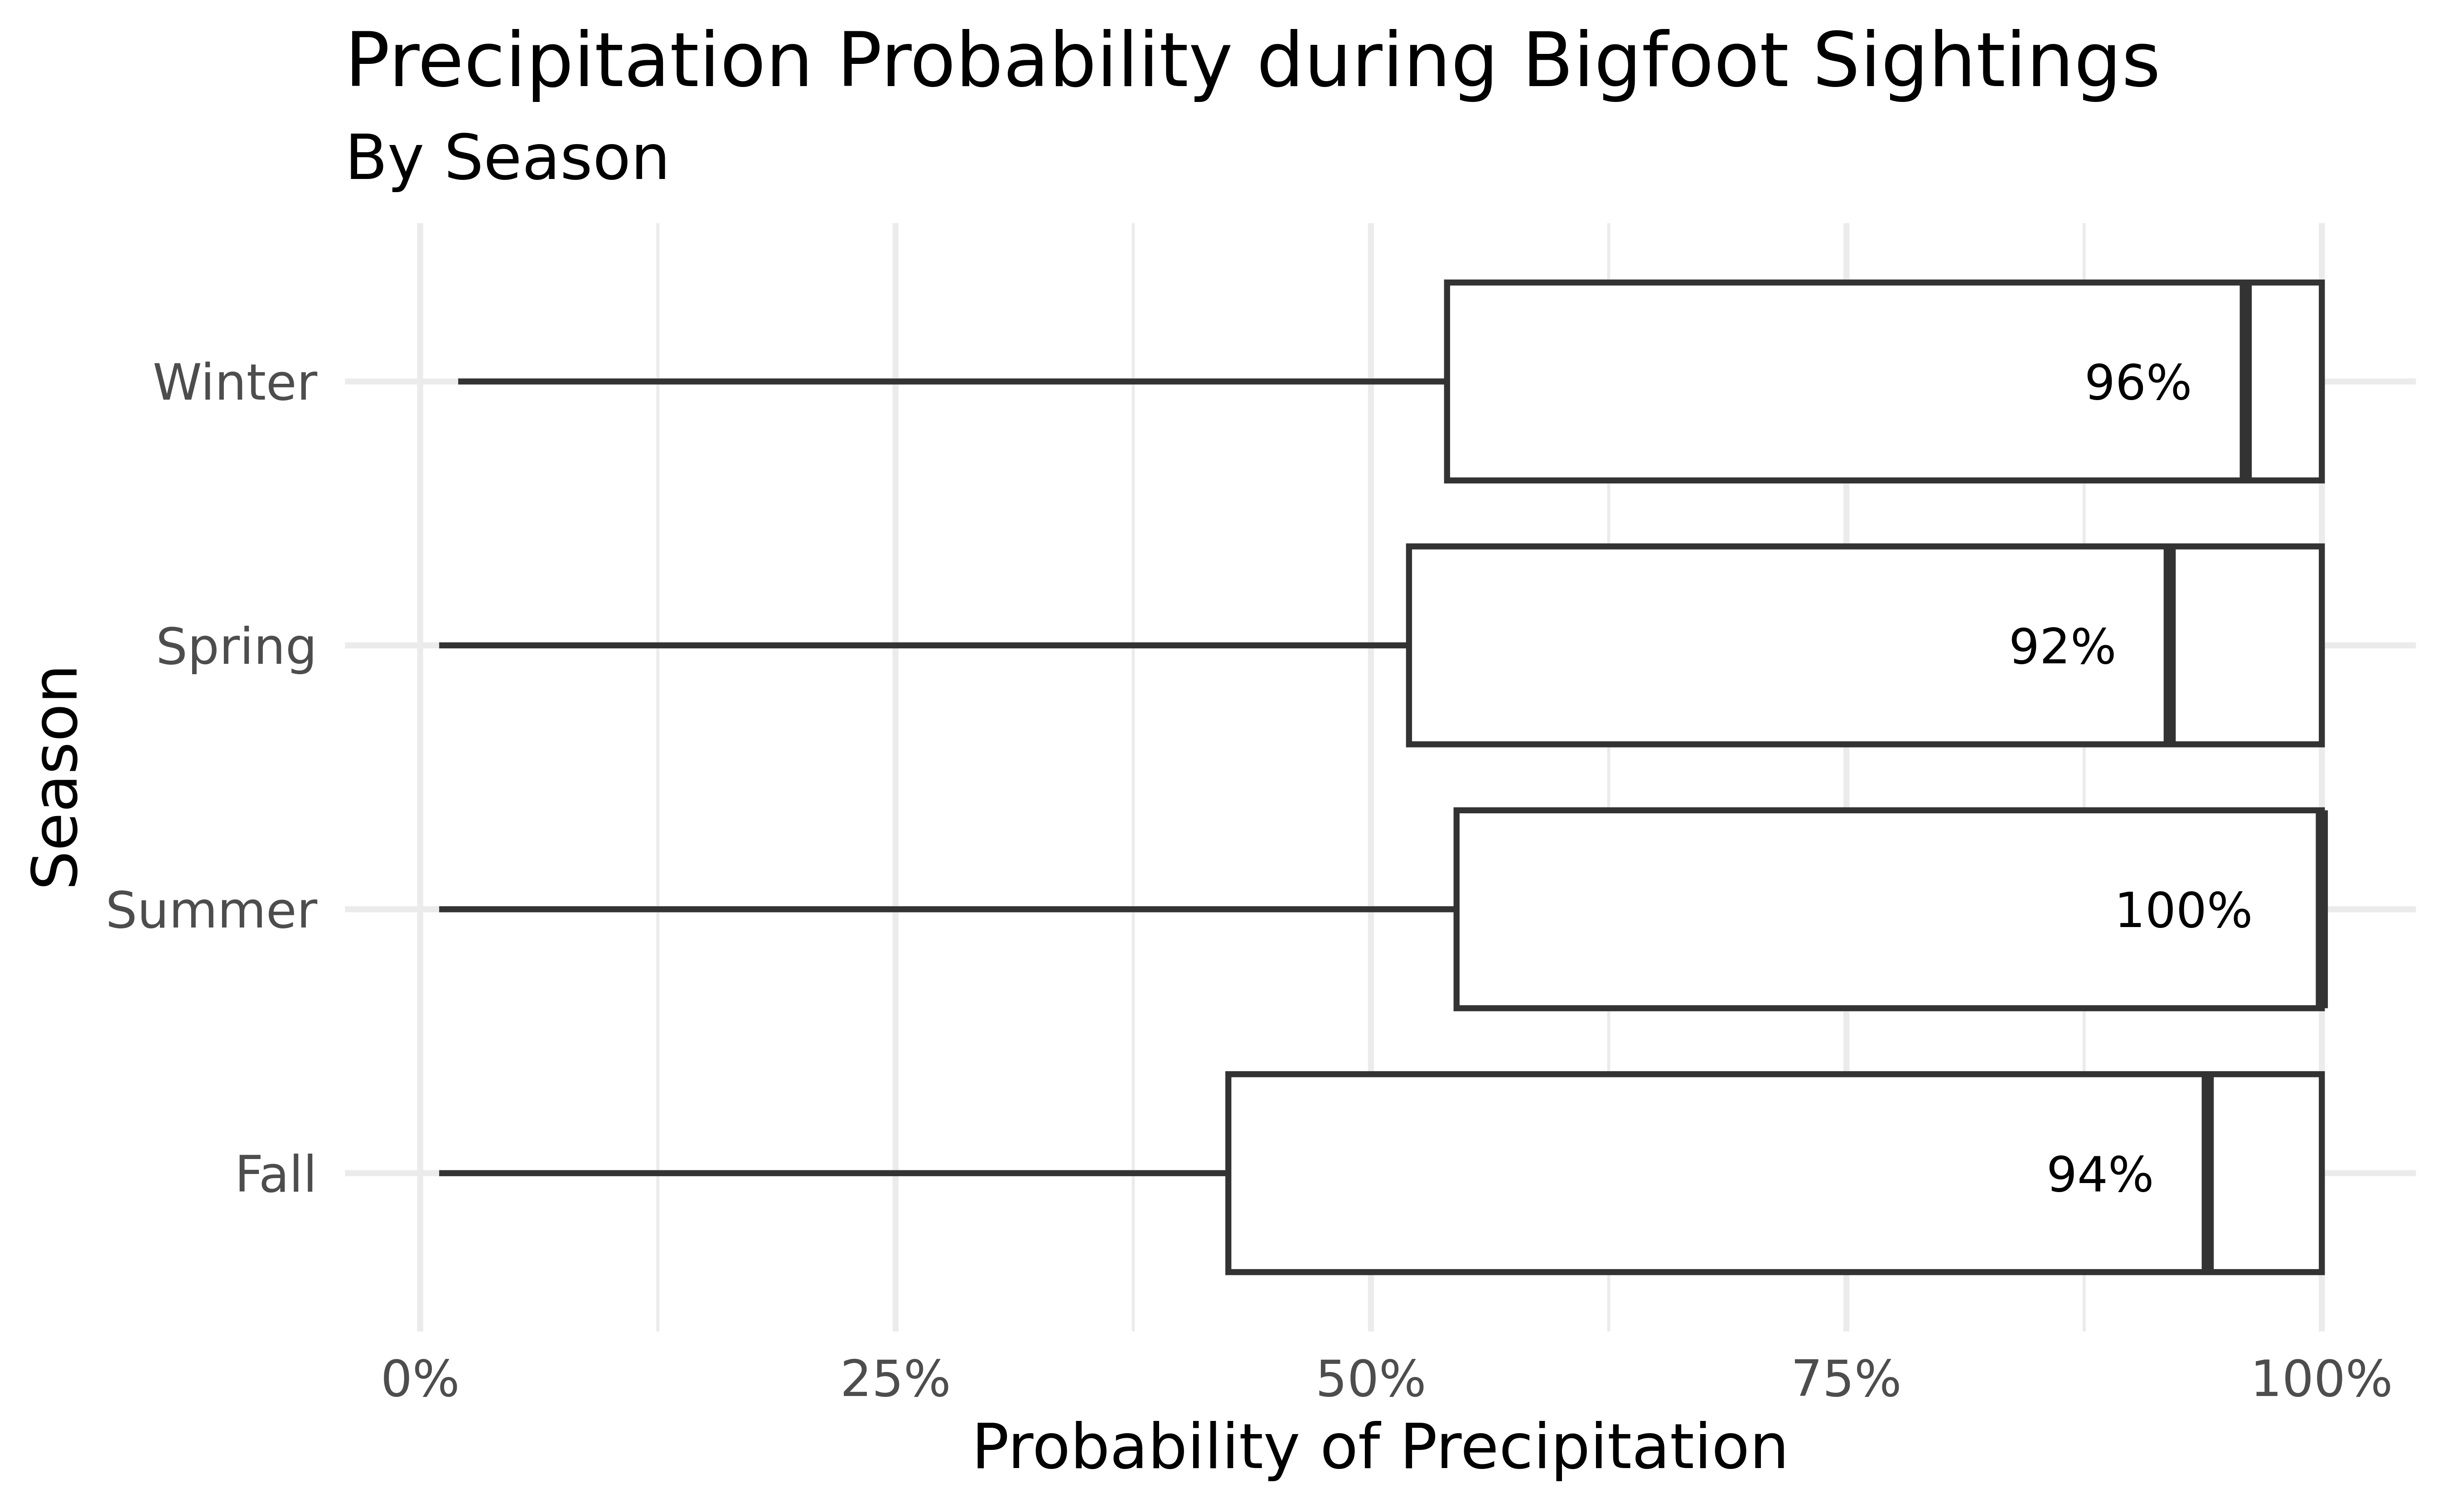
Probability of Precipitation = (Confidence in Precip) x (Area of Precip)
Source: Roger Patterson and Bob Gimlin, California 1967