Visualizing the relationship between dog traits and breed popularity
STA/ISS 313 - Project 1
Abstract
We used Tidy Tuesday’s “Dog Breeds dataset to create four visualizations pertaining to the popularity of American Kennel Club-registered purebred dog breeds. One plot looked at fluctuations in popularity over time among the 20 breeds that were overall most popular during the years included in the data set. A second plot investigated the differences in coat length and type between the breeds that increased and decreased the most in popularity across the years in the data set. A third plot illustrated the differences in breed traits between the most popular and unpopular dog breeds. Finally, our fourth plot visualized the actual values of the five traits that were identified by the third plot as most associated with popularity/ lack of popularity for 20 popular and unpopular dog breeds. Overall, our analysis provided insight into dog breed popularity over time, as well as the physical and personality traits most closely related to popularity itself and to changes in popularity.
Introduction
The aim of this project is to use The Tidy Tuesday “Dog Breeds” data set to visually explore questions about dog breed popularity. The Tidy Tuesday repository contains three datasets taken from the American Kennel Club, which is a registry of purebred dog pedigrees in the United States. One of the three data sets (breed_rank) contains information about the popularity rankings of 195 dog breeds each year from 2013 to 2020. The other two data sets (breed_traits and trait_description) contain information about 16 different traits of each breed, as well as a detailed description of each of those traits. Traits described in the data set include physical characteristics like coat length and shedding level, as well as personality traits like playfulness, energy, and trainability. Most of the traits are ranked on a scale from 1-5, with the exception of coat length and coat type. For our analysis, we aimed to use creative data visualizations to explore dog breed popularity, both over time and as it relates to various breed characteristics.
We aimed to answer two major questions. The first was as follows: How have the top twenty most popular dog breeds across all years of the data set fluctuated in popularity throughout these years, and how are coat length and coat type related to increases and decreases in popularity? Answering this question required the use of the year-by-year popularity ranking in the breed_rank data set, as well as Coat Length and Coat Type from the breed_traits data set. Our second question was: In 2020, what are some of the dog personality traits that are associated with being the most and least popular breeds? To assess this, we again used the year-by-year breed rankings to determine overall popularity, and then we looked at traits in breed-traits that were ranked from 1 through 5 (all traits other than Coat Length and Coat Type). From there, we selected a subset of traits to explore more deeply in our analysis of the relationship between breed popularity and breed traits.
Question 1: Popularity of breeds over time in relation to coat length and type
Introduction
For the first portion of our analysis, we chose to investigate the fluctuations in popularity of the top 20 all-time most popular dog breeds over time and assess whether changes in popularity appeared to be at all related to coat length and type. We chose this question because we thought it would be interesting to visualize the extent of year-to-year fluctuations in popularity, and also because we suspected that changes in dog popularity might be more related to observable traits like coat length and type than to personality characteristics. As a specific example, we’ve all noticed that “doodles,” or poodle mixes with curly hair, seem to have become increasingly popular in the last few years. While this data set only contains information on purebred dogs, an increase in poodle popularity could also be a reflection of this trend.
For the first part of this question, we used 2013 Rank through 2020 Rank corresponding to each Breed in the breed_rank data file to determine the 20 overall most popular breeds in the data set. Then, we combined these variables into one by pivoting the data longer in order to plot popularity against time. For the second part of this question, we calculated the difference in popularity between 2013 and 2020 for all dogs and then chose the breeds that increased and decreased the most in popularity between those years. We then plotted the frequency of different Coat Lengths and Coat Types (from the breed_rank data file),faceting so that viewers can see differences in coat characteristics between the 10 breeds that increased the most and the 10 that decreased the most.
Approach
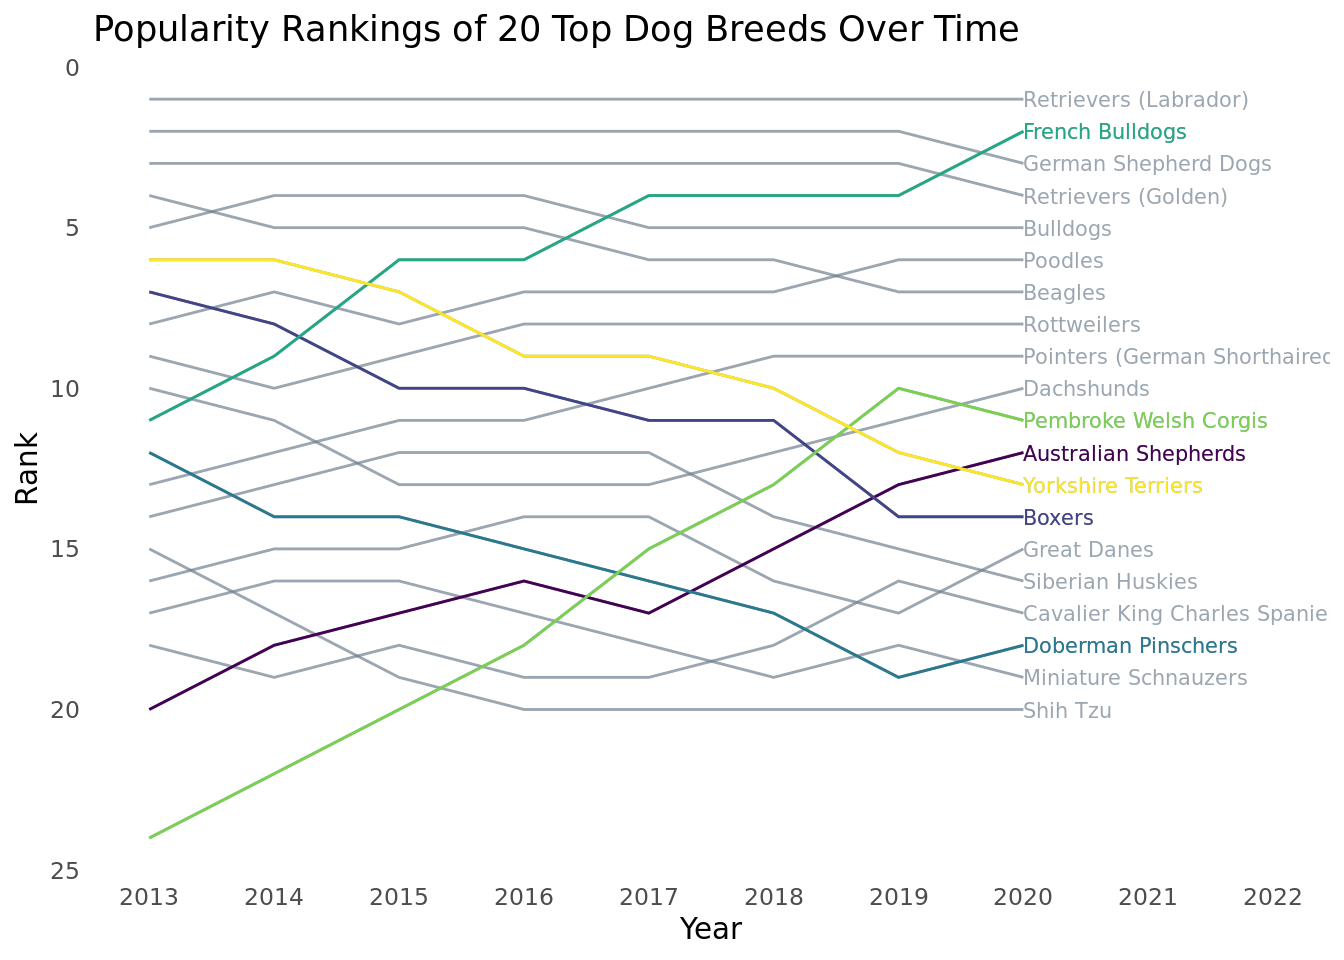
To address the first part of our question, we chose to make a line graph showing the fluctuations in popularity of the 20 overall most popular dog breeds in the data set. We colored by dog breed so that each breed had its own line, but then used the gghighlight package to color only the breeds that fluctuated the most over time. We then labeled each line with the name of the Breed it represented using the directlabels package. This format was the best way to answer our question because line graphs are very intuitive when looking at time-series data; our brains naturally read them from left to right. Additionally, highlighting only the breeds with notable trends helps viewers to pick out important patterns; if we had kept the default setting, which assigned a different color to all 20 breeds, it would have been quite difficult to process the information on the plot.
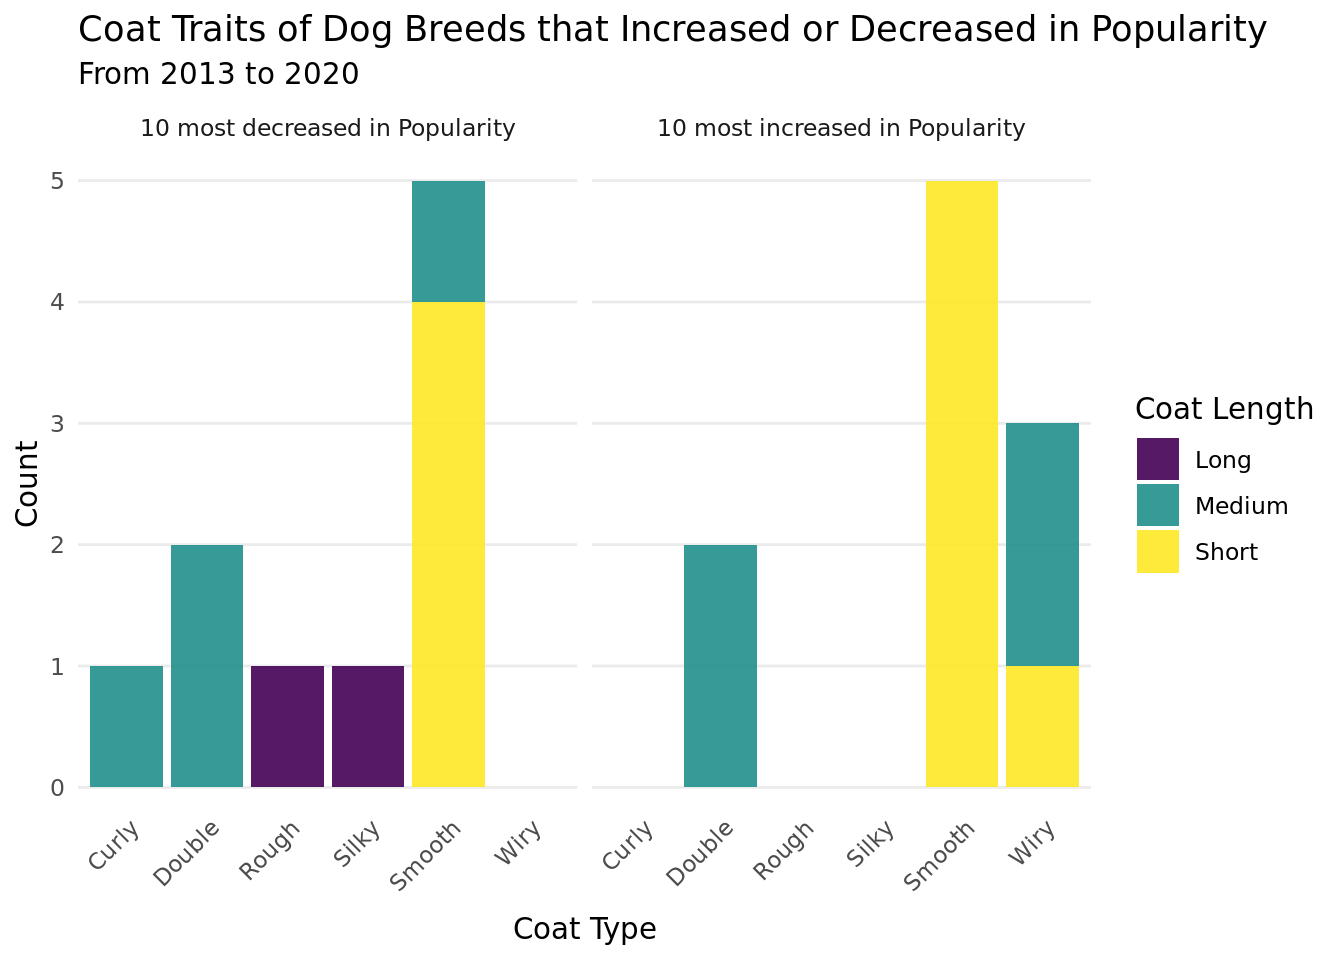
To address the second part of our question, we created a bar chart showing coat characteristics for the 10 breeds that increased the most in popularity from 2013 to 2016 and the 10 breeds that decreased the most in popularity from 2013 to 2016. The chart is faceted by a binary variable that indicates whether each breed is in the increasing/ decreasing category, Coat Type is on the x-axis, and we’ve colored by Coat Length. This kind of plot is quite effective for answering our question because we’ve been able to illustrate three variables using three different plot elements (faceting, stacking and the x-axis) without creating a plot that is at all messy or congested-looking. We also wanted viewers to be able to interpret our plots easily, and bar charts are probably the most intuitive kinds of graphs to read when identifying trends in categorical data. Additionally, Coat Type and Coat Length are inherently related (in that certain combinations are likely more common and others are likely rare or nonexistent). Our use of a stacked bar chart lets viewers observe those relationships for themselves.
Analysis
Discussion
Our first, plot, which shows the fluctuations in popularity of the 20 dog breeds that were overall most popular in the data set over the years, shows several broad trends and many more specific trends. First of all, the plot was neater than we expected. In other words, dog breed popularity rankings, for the most part, did not fluctuate a lot over time, even within the top 20 most popular breeds. For example, Labrador Retrievers stayed at the #1 most popular spot for all years of the data, and German Shepherds and Golden Retrievers each only shifted one spot. Furthermore, only the breeds that are highlighted (French Bulldogs, Pembroke Welsh Corgis, Australian Shepherds, Yorkshire Terriers, Boxers, and Doberman Pinschers) have differences between their highest and lowest popularity scores that are greater than 6. Another related overall trend is that for the most part, popularity rankings tended to stay stagnant for at least several years at a time even if they did change during the years of the data. For example, the Shih Tzu decreased in popularity from 2013 to 2016 but then remained at spot #20 from 2016 to 2020; as a similar example, Rottweilers’ ranking shifted twice in the early years of the data but then stayed constant from 2016-2020. A possible explanation for the fact that breed popularity did not fluctuate as much over time as we would expect is that within the twenty all time most popular breeds there are large differences between breeds the numbers of dogs purchased and registered with the AKC each year (which is what determines popularity). Because these differences are so large, it may take some sort of marketing campaign, change in media attention, or just a sizable increase in breeding for one breed to overtake another within these top breeds. We hypothesize that if we plotted the fluctuations in popularity for the dog breeds that were 20th to 40th for all-year popularity, we would see more overlap because breeds would be closer in numbers. There are also a few notable breed-specific trends in popularity. From 2013 to 2020, French Bulldogs climbed from the 11th to the 2nd most popular dog breed; additionally, Welsh Corgis climbed from the 25th to the 11th most popular from 2013-2019, dipping to the 12th spot in 2020. It’s hard for us to pinpoint the exact reasons for these trends, but we can all say anecdotally that we’ve seen a lot more social media content related to these breeds in the last couple of years. It’s likely that increasing popularity may have kind of a “snowball” effect– breeds that get more popular get more media attention, in turn increasing their popularity even more.
Our second plot, which shows the relationship between coat characteristics and increasing or decreasing popularity, showed several fascinating trends. The most striking trend was there were two long-haired dog breeds out of the 10 breeds that decreased most in popularity, and none out of the 10 breeds that increased most in popularity. This may reflect long-haired dog breeds falling out of favor in recent years (which may in turn be related to the popularization of hypoallergenic dogs that don’t shed at all). Additionally, three dogs with a “wiry” coat type were among the 10 breeds that increased the most in popularity, while there were no dogs with this coat type in the group that decreased the most in popularity. Again, this might be related to people overall favoring short-haired dogs over long-haired dogs in recent years. While these trends are certainly interesting, coat length and type were not as different between the 10 breeds that increased and decreased the most in popularity from 2013-2020 as we might expect if these variables were major explanatory factors. Dogs with short, smooth coats were the largest groups from both cohorts, and there were two dogs with medium-length, type double coats in each. Ultimately, we suspect that dog breed popularity increases and decreases are likely related to a plethora of factors; in recent years, with the rise of social media, dog breed popularization or depopularization may be more related to trends in specific breeds due to media attention rather than to the rise and fall of more general preferences across the population like coat length and type.
Question 2: What Breed Traits are Associated with Popularity and Unpopularity?
Introduction
For our second question we wanted to investigate any differences in traits between popular and unpopular dogs. For example, what traits do popular breeds rank higher in compared to unpopular breeds? Are popular breeds especially friendly? Do they get along with other dogs better than unpopular breeds? By visualizing these differences we hoped to gain insight on traits associated with popularity in an effort to see what traits are most important to dog owners when picking a breed of dog. While we cannot fully answer this question with just visualizations, we hope our visualizations can hint at traits that are important to dog owners.
To answer this question, we focused primarily on traits that are ranked 1-5 in the dataset. This includes traits like trainability, playfulness, barking level, etc. In addition, we used the 2020 popularity rankings as we were interested in only the most recently popular dog breeds.
Approach
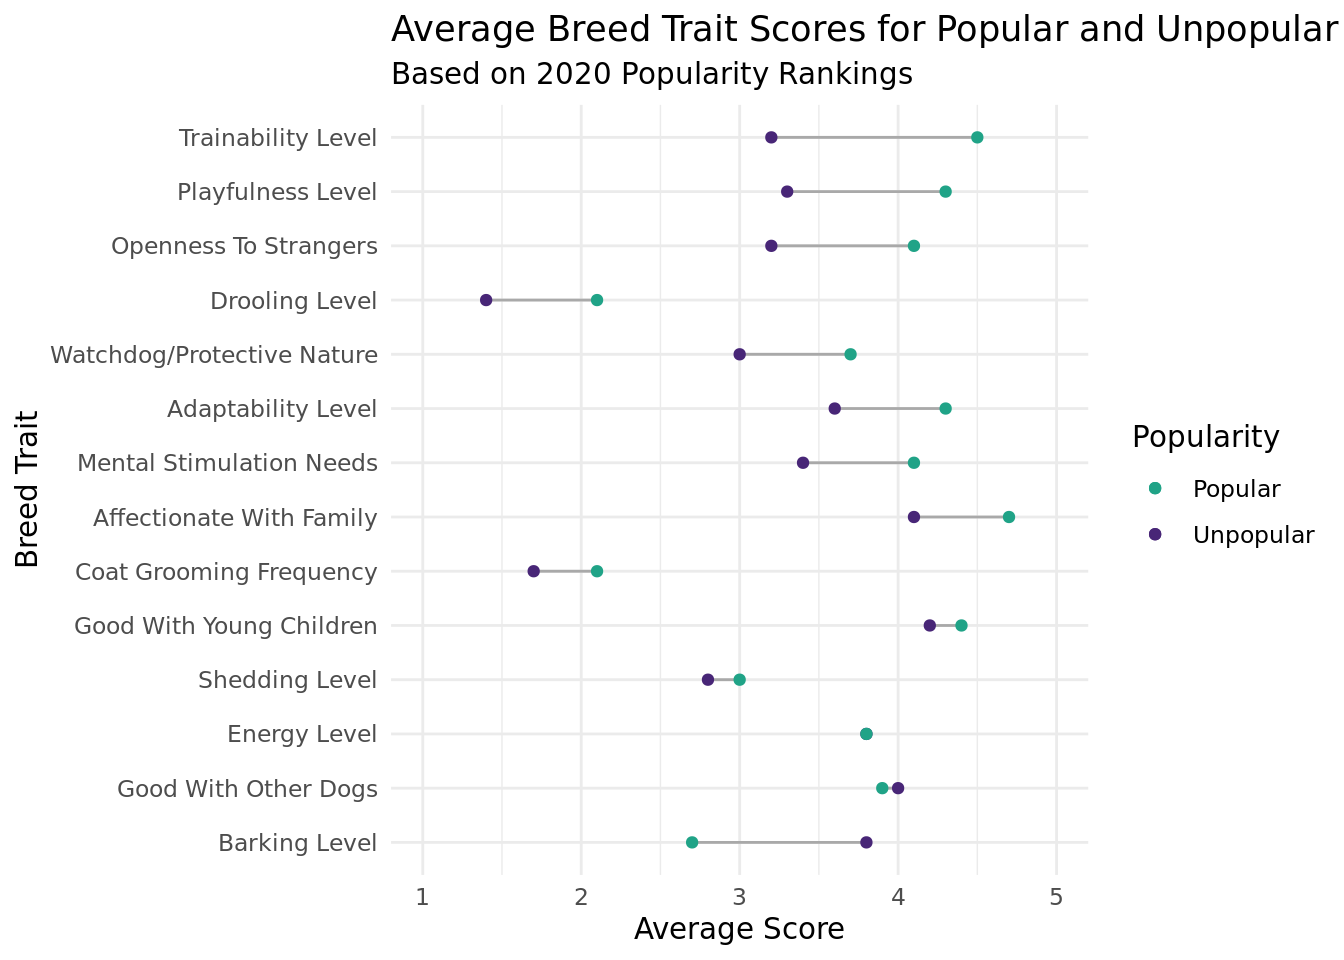
Our first plot addressing this question is a variation on a lollipop plot. To make this plot, the top 10 most popular and unpopular dogs of 2020 were identified. Their average trait scores were graphed with color used to differentiate between popular and unpopular dogs. In this plot, the “stem” of the lollipop connects the average trait score between the popular and unpopular breeds. This was done because the focus of this plot was to identify differences in trait scores between popular and unpopular dogs. The length of this stem helps to represent these differences, with longer stems representing greater differences. Additionally, while it was suggested that we include a measure of variance in the plot, it was decided that the error bars cluttered the graph up too much, making it hard to see the differences in trait score.
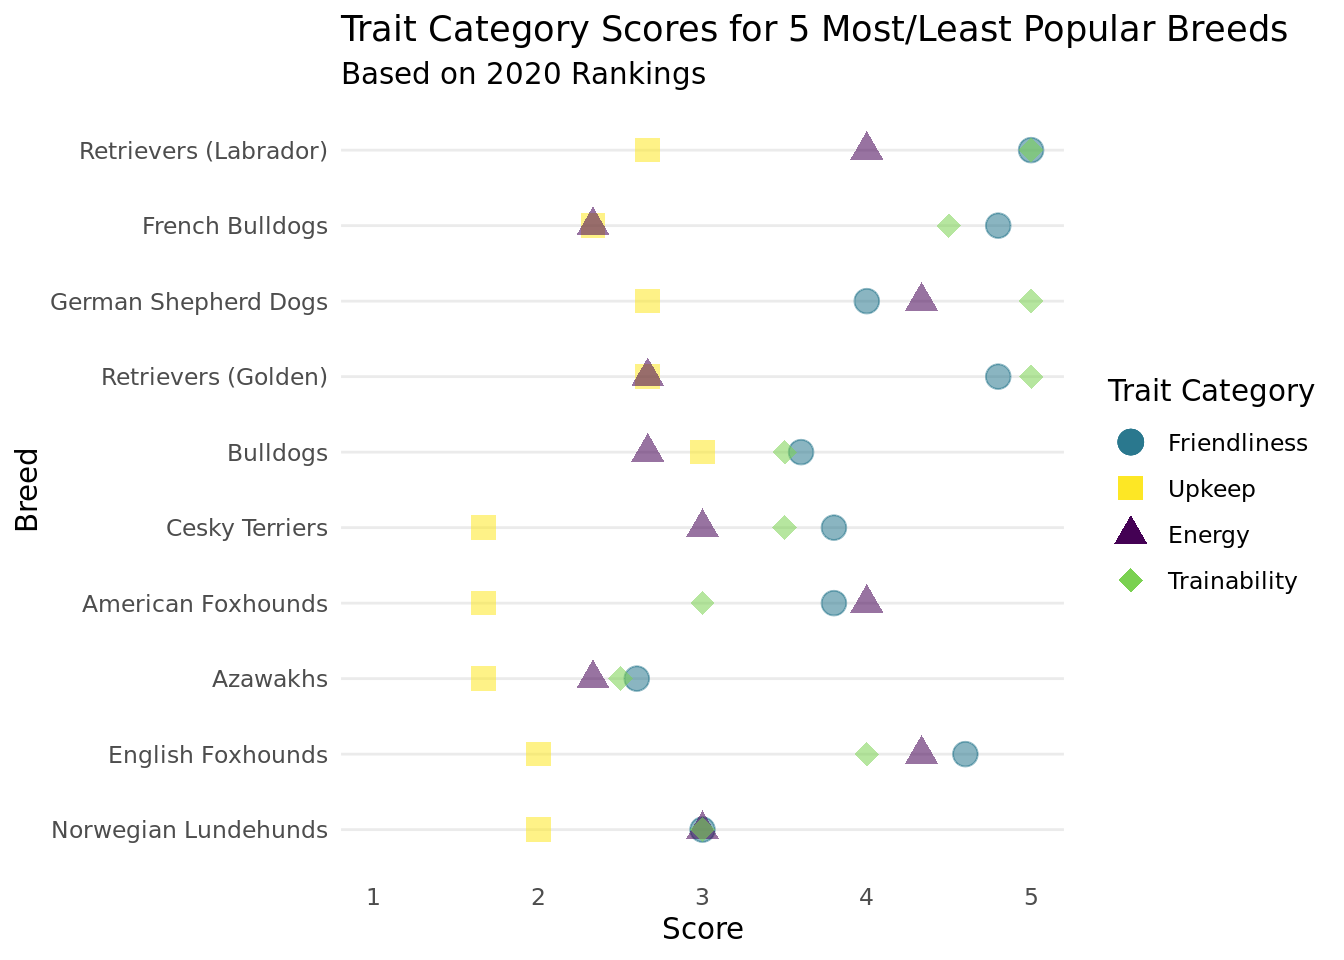
The second plot shows how scores for trait categories vary across specific breeds. In this visualization, the 5 most popular and least popular dog breeds of 2020 are spread across the y-axis. Initially, individual traits were plotted for each breed. However, this led to a great deal of overlap in the plot since most traits are scored as a 3, 4, or 5. Thus, to create more variance in the scores, we grouped 14 of the traits into the following categories: friendliness, upkeep, energy, and trainability. The average of the scores in each category was then calculated and plotted for each breed. Each trait category has a distinct shape and color to increase visibility and help distinguish differences in scores.
Discussion
Although the process of selecting a dog breed to own is highly subjective and dependent on personal preferences, the plots shown above indicate that there are certain traits that are clearly favored over others. From the first plot, which shows differences in average trait scores between the 10 most popular and 10 least popular dogs, we notice that there are large differences in scores for trainability level, playfulness level, openness to strangers, and barking level. Overall, these trends make sense as people generally own dogs for their affection and companionship as opposed to other pets that might be more independent. In addition, many owners may prioritize “family dogs” that are easier to train and like to play with family members. One trend that was a bit surprising was the large gap between average scores for barking level. While it makes sense that barking may be viewed as a nuisance for owners and neighbors, we did not think that barking level was a trait that people were necessarily selecting for when deciding what dog breed to own. From the team’s past experiences owning dogs, we hypothesized that people mainly choose breeds based on physical appearance, affection level, and ease of training. However, it may be that dogs that are naturally more friendly and easier to care for also bark less.
Although there were large gaps in scores for some traits, there were also traits where the difference was small to moderate. For example, there appears to be little difference in average scores for coat grooming frequency, tolerance/patience with young children, shedding level, energy level, and friendliness with other dogs. For the most part, these findings are unexpected. For example, our second visualization for the first question suggested that breeds with longer hair have fallen out of favor over time. Usually, breeds with longer hair require more coat grooming, which is why we expected to see greater variation in scores. However, this was not the case. In addition, there is almost no difference in shedding level between popular and unpopular dogs. One explanation for this is that some of the most common dog breeds such as labrador retrievers, German shepherds, and golden retrievers all are known to shed a lot. Finally, it is interesting that openness to strangers and affection with families do not translate to friendliness with other dogs. In fact, the first plot indicates that the least popular dogs are actually more friendly with other dogs than the most popular dogs! Overall, this is confusing, but one explanation could be that the most popular dogs are also more protective in nature, which could lend itself to being less friendly with other dogs.
From the second visualization, we are able to see in more detail how traits for specific breeds are scored as opposed to an average of the top/bottom 10 breeds. This plot confirms many of the previously discussed observations from the first plot. We see that labrador retrievers, French bulldogs, and golden retrievers are all rated as friendly breeds. In addition, the top 4 breeds are also highly trainable compared to the bottom 5 breeds. Surprisingly, the more popular breeds on average require more upkeep than unpopular breeds, which could be attributed to their greater drooling levels. One trait that does not seem to be correlated as strongly with popularity is energy level, which varies across the top 5 and bottom 5 breeds.
Overall, although our visualizations capture many aspects of the decision-making process behind owning a dog, there are also factors that it does not consider. For example, one of the most important considerations is the size of the breed. For people living in apartments, this is an especially important trait. In addition, some breeds have specific health complications that are not captured in the data. Through our visualizations for the first and second questions, we have painted a fairly detailed picture of how breeds have changed in popularity over time and what traits are most and least popular. However, there is also room to expand if additional outside data were merged in.