Investigating America’s Most Reputable Companies
STA/ISS 313 - Project 1
Abstract
Our project aims to investigate the different factors that contribute to customer perceptions of notable company reputations. We’ve interacted with many of these companies before, yet our familiarity with these entities is limited solely to their name recognition. In an effort to expand our knowledge and gain a more comprehensive understanding of their respective positions, we aim to delve deeply into the available data from the 2022 Axios-Harris Poll which contains information concerning company scores for specific attribute categories in 2022, as well as how these scores and overall rankings have changed over time. By investigating differences in scores between industries, the relationship between attribute categories, and changes in company scores over time, we hope to achieve better insight on the intricacies of what may influence company reputations.
Introduction
The dataset that we are using comes from the TidyTuesday project that uses data from the Axis-Harris Poll, which investigated the reputation of the most visible brands in America. The Harris Poll conducted a survey in February 2022 among a representative sample of the American population to identify the companies that were most prominent in the public’s mind. The top 100 companies with the highest number of nominations were included in the “Most Visible” list. The poll actually resulted in two datsets: `polls` and `reputation`. The polls dataset has 8 variables and 500 observations. This dataset has each company’s industry, overall ranking, and RQ score in 2022 as well as information about each company’s rating from 2017 to 2021. RQ scores are a metric that is a combination of each company’s rating for each specific attribute. The attributes are: trust, ethics, growth, p&s, citizenship, vision, and culture. It is specifically calculated using the formula: [ (Sum of ratings of each of the 9 attributes)/(the total number of attributes answered x 7) ] x 100. Additionally, score ranges are: 80 & above: Excellent | 75-79: Very Good | 70-74: Good | 65-69: Fair | 55-64: Poor | 50-54: Very Poor | Below 50: Critical. Next, the reputation dataset has 10 variables and 700 rows or observations. This dataset is only from the year 2022, and shows the individual breakdown for how companies were scored and ranked based on the 7 attributes mentioned previously1. This dataset is important for illustrating the specific attribute categories that different companies and their industries scored well or poorly on.
Question 1
How do customer ratings of company attributes vary by industry and how do these attributes relate to one another?
Introduction
Our first question aims to explore the different attribute scores that customers gave these notable companies in 2022, and how these scores may vary by industry. We are interested in investigating the differences behind these attribute scores because industries usually have diverse policies and mission statements that cause them to place emphasis on different company aspects. Consequently, we are interested in examining which industries scored the highest for each of the 7 attribute categories, how the distribution of these scores differ, and if there is any overlap in industries between the different attributes. Additionally, we decided to go one layer deeper and examine the relationship between these specific company attributes. We thought it would be interesting to see how customer perceptions of these attributes affected one another and if high or low scores in one category would lead to differences or similarities in other categories. To answer these questions, we need to examine information from the `reputation` dataset. Specifically, we will be looking at the `name` variable which represents company attribute, `score` which is the score given by customers for each attribute, and `industry` which signifies the specific industry that companies fall under.
Approach
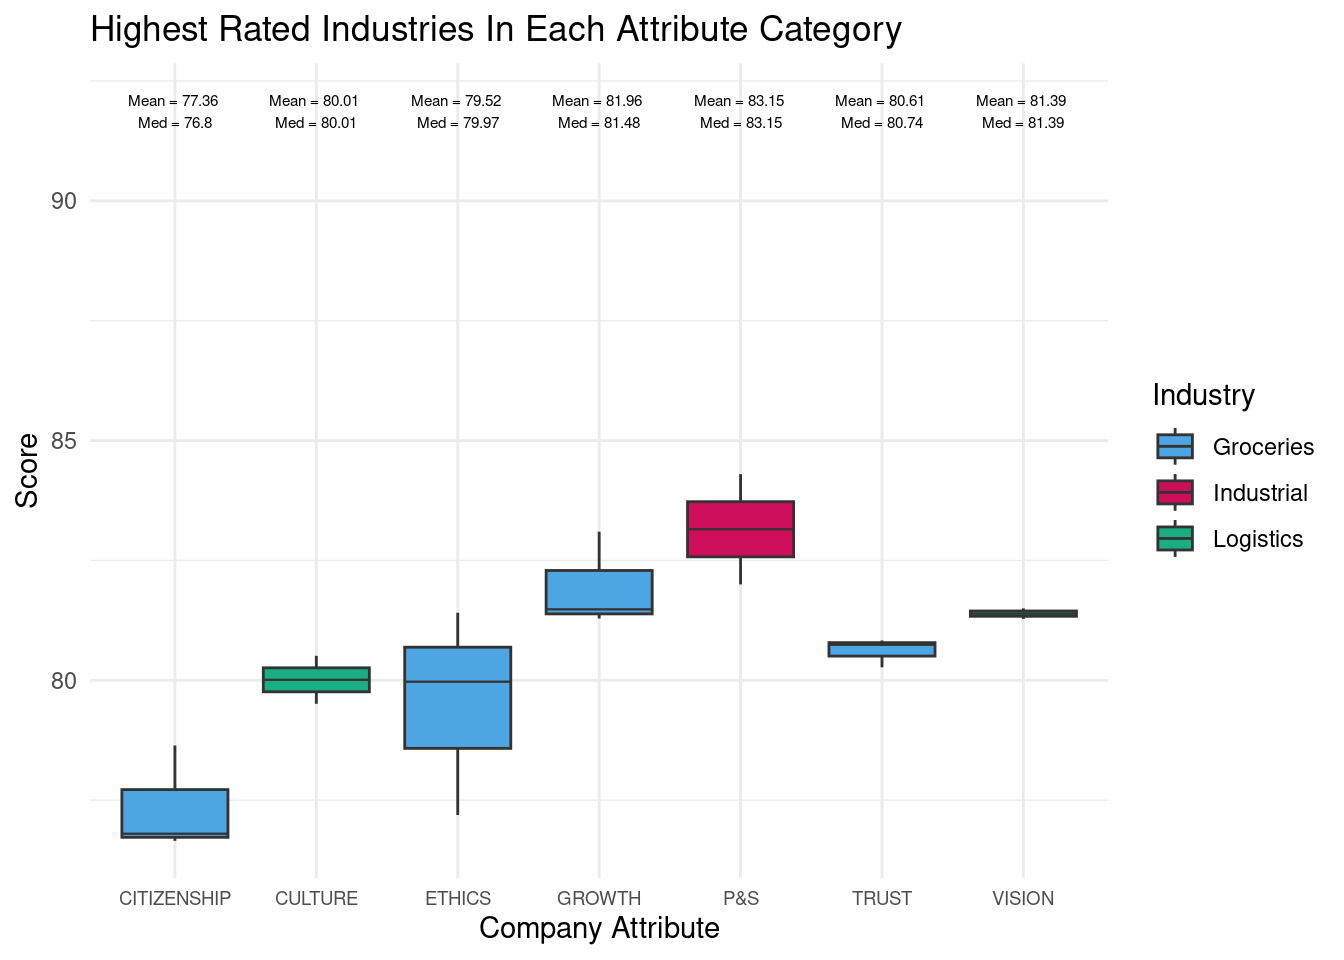
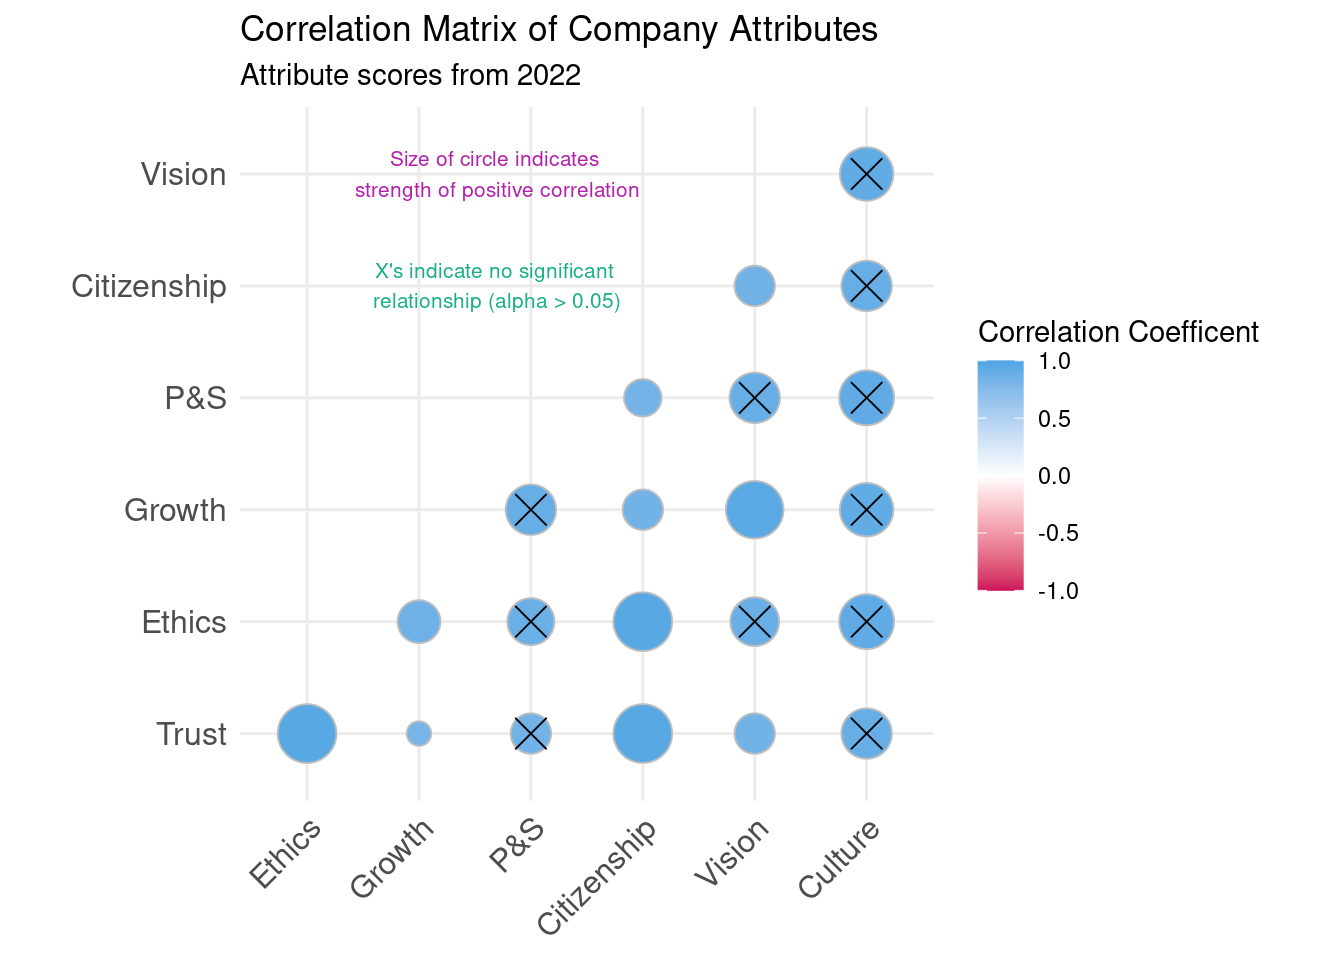
We choose comparative boxplots for our first visualization of question 1 to see what attributes in 2022 consumers valued in companies across different industries. Each boxplot represents the industry that scored highest, on average, for that attribute. A side-by-side comparison of these boxplots allows us to analyze the similarities and differences in the center and spread of each attribute. This allows us to answer the question of what were the most important attributes to consumers and how industry affected that question. For our second visualization, we constructed a correlation matrix of all seven attributes in 2022. While our first visualization gave us a broader understanding of attributes consumers valued, we wanted to dive deeper on if consumers were likely to give similar ratings across different attributes. To answer this question, we chose a correlation matrix because it shows the correlations between all seven attributes in one visualization. Also, p-values can be added to the visualization to show if any two attributes have a significant relationship. This visualization shows if a consumer’s rating for one attribute was likely to predict his or her rating for a different attribute.
Analysis
Visualization #1
Visualization #2
Discussion
The first visualization that we created to answer this question was a multiple boxplot graph of the highest scoring industries for each of the 7 attribute categories. The visualization reveals overlap for many of the attributes, with the most prevalent industry being “Groceries,” which was the highest scoring industry in the citizenship, ethics, growth, and trust categories. The second most prevalent industry was “Logistics,” which scored the highest in the culture and vision attribute categories. Lastly, the “Industrial” industry scored the highest in the P&S (product and service) category. The relatively straightforward nature of grocery stores most likely accounts for “Groceries” being the highest scoring industry. It is typically hard to find anything wrong with the way in which grocery stores conduct their businesses, which could explain why they scored so high in many of the categories. Grocery stores are also reliable and trustworthy in terms of fulfilling their mission–supplying individuals with food–causing individuals to have more positive feelings about this industry as opposed to industries such as the technology or financial services that might generate more polarizing opinions. Additionally, the boxplots also illustrate the spreads of the attribute scores for their corresponding industry. The “Groceries’’ ethics scores had the greatest variability in values. Since ethics is usually very subjective in nature and depends on the distinctive experiences of individuals, this could explain the wider range of score values. Comparatively, attributes such as”Trust” and “Vision” had smaller spreads, meaning the score values were much more similar. This could be because of the more objective nature of what trust and company vision mean for customers. Lastly, it is important to note that the attribute scores were highest, on average, for the industrial industry in the “P&S’’ category and lowest for the grocery industry in the”Citizenship” category. This is probably because Product and Service is usually impartial in nature since a company that produces useful and functional products will generate higher scores from customers because it meets the goals that it markets. However, social responsibilities (company citizenship) is probably not something that companies will focus on tremendously, and even if they do, it may not be something that individuals are the most aware about.
The correlation matrix shows how any two company attributes in 2022 were strongly correlated with each other, though not all had significant relationships. All of the pairs of attributes have correlations of R > 0.80, so they are all strongly or very strongly positively correlated. Simply put, this means that a consumer’s high rating for any attribute likely correlated with a high rating for all other attributes. There are two reasons why this trend makes sense. First, a consumer’s general feeling of a company probably causes them to rate attributes similarly. Second, there is overlap in some of the attributes such as “Citizenship,” “Trust,” and “Ethics,” which all relate to if consumers see a company as socially responsible. This point also potentially explains why some correlations are stronger than others. Two attributes like “Trust” and “Growth” are more different ideas than “Trust” and “Citizenship.” However, despite the commonality of strong correlations, not all attributes significantly predict other attributes. Only 10 of the 21 attribute pairs are significantly related. Thus, considering the p-values of the attribute relationships shows that some of the strong correlations aren’t as robust as others. Furthermore, the main trend among the significant relationships is that the attribute “Culture” does not significantly predict any other attributes and is the only attribute that does so. This suggests that a consumer’s evaluation of a company’s culture does not have a predictive affect on how the consumer would rate that company on a different attribute. Since company culture relates more to the company’s workplace and less to how it interacts with consumers, it’s understandable how consumers may separate this attribute from others.
Question 2
How does company RQ score change between the years of 2017 to 2022 and are the trends consistent with their overall industry?
Introduction
Our second question seeks to investigate how companies’ RQ scores may have changed from the years 2017-2022, and whether their increase (or decrease) matches the overall trends in their respective industries. We’re interested in investigating companies across different industries that are highly reputable, but may have experienced either a decline or rise in the public’s eye. To that end, we investigated the top 3 companies that saw the greatest rise and greatest fall in RQ score. On a broader level, we explored the mean RQ score of each of these companies’ industries, and how they changed overtime. To answer these questions for our analysis, we need to examine information from the ‘polls’ dataset. Specifically, we explore the ‘company’ variable which represents the name of the company, ‘industry’ which represents the specific industry that a company falls under, ‘2022_rq’ which represents the company RQ score in 2022, ‘rq’ which represents the company RQ score outside of 2022, and ‘year’, which represents the year at which the RQ score was recorded (2017-2021).
Approach
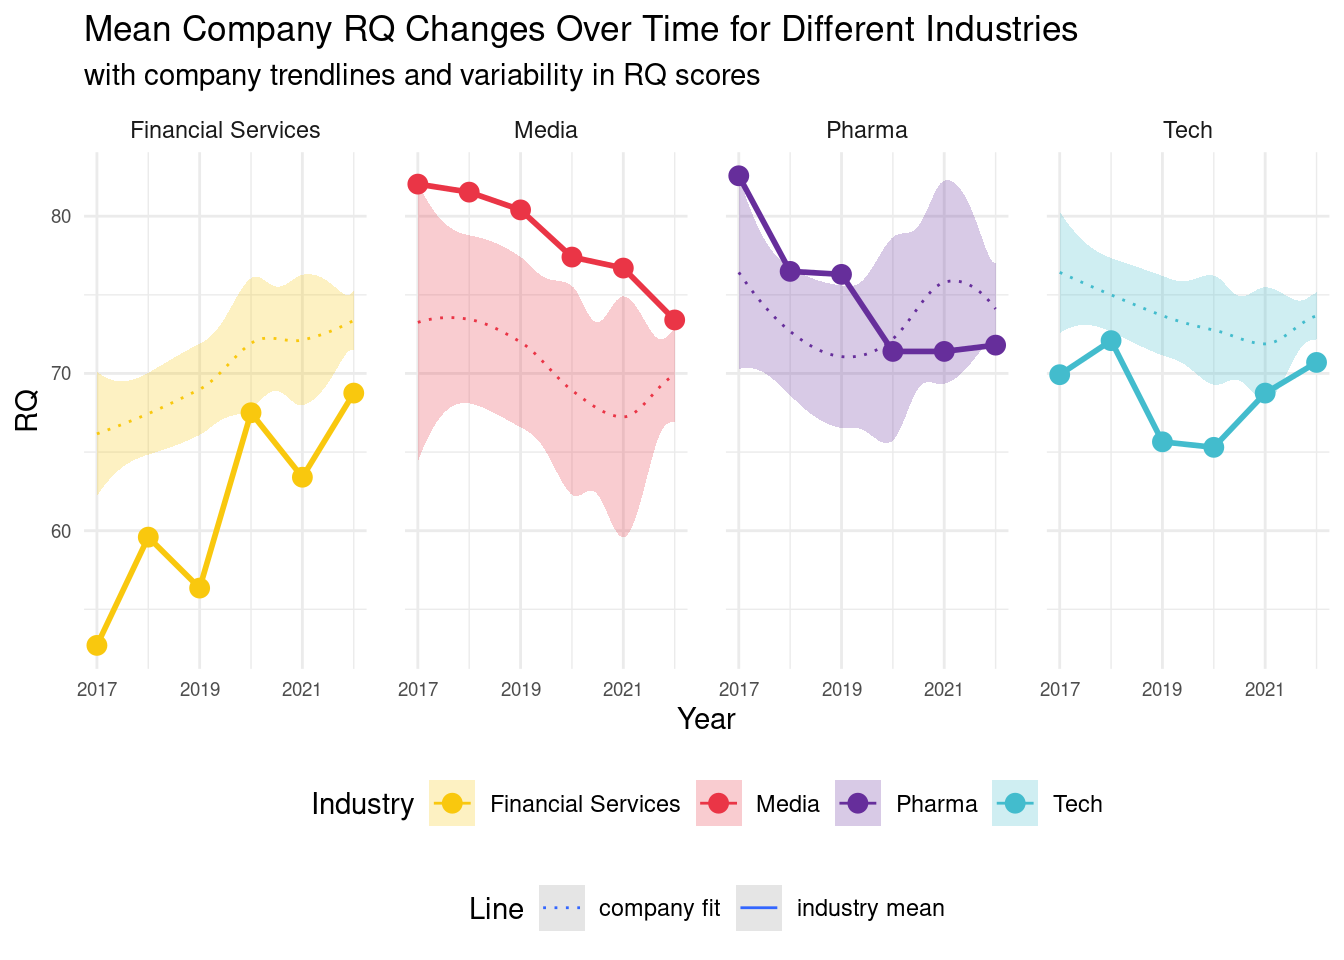
We chose a line graph to answer the first part of question 2 because line graphs are effective ways to visualize trends in data over time, and animated line graphs can show these trends in a dynamic way. This is the best visualization because it allows us to easily see how a company’s RQ score has changed over time and how it compares to other companies in the industry. The animation aspect makes it easier to identify trends year-over-year. Additionally, by focusing on the top 3 companies with the greatest changes in RQ score, we can highlight the most significant trends in the data and identify potential areas of further investigation. Each line was labeled with a company while it was colored by industry for readability. The second visualization also utilizes line graphs and includes two lines for each industry: a line of best fit showing patterns in company RQ score within each industry, along with a line connecting the mean RQ score for each industry for each year. Additionally, points representing the mean RQ score for each industry for each year are plotted on the line. Building off the first visualization, the side-by-side plots of RQ change over time for different industries allow for easy comparison of industry-level trends in RQ score over time. Meanwhile, the lines of best fit with confidence intervals show within-industry variability between companies. Colors are used to distinguish industries, aligning colors with the previous visualization for ease of comparison. Dotted and solid lines are utilized to distinguish between the lines representing mean RQ score per industry and the lines representing trends for company RQ scores for each industry.
Analysis
Visualization #1
Visualization #2
Discussion
The first visualization shows that the companies with the greatest increase in RQ score from 2017-2022 were Goldman Sachs, Wells Fargo, and Samsung. The plot revealed that the two financial companies experienced the greatest increase in RQ score from 2019-2020. Surprisingly, among the two tech companies, Samsung ranked 3rd in greatest increase, while Facebook ranked 1st in the greatest decrease in RQ score from 2017-2022. Samsung’s increase may be associated with the release of their “infinite display” phones in 2018. Meanwhile, Facebook’s sharp decline from 2018-2019 was likely associated with rising awareness around the consequences of social media use. Aside from Facebook, Walt Disney and Johnson & Johnson also experienced the greatest declines in RQ Score from 2017-2022. From 2020 onward, Walt Disney experienced a sharp decline in RQ rating, which is likely due to the closing of their amusement parks post-pandemic. Meanwhile, Johnson & Johnson experienced a leveling in their RQ score, which may have been due to their work manufacturing a vaccine.
The previous visualization included companies from four industries: Financial Services, Media, Pharma, and Tech. This visualization explores changes in RQ scores over time for each of these four industries. For each plot, a line connects points that represent the mean RQ score for each year for each industry. Variability in company RQ score is represented by a shaded confidence interval behind each solid line, along with a dotted line of best fit. This visualization reveals that the industry with the greatest increase in mean RQ score between 2017 and 2022 was Financial Services. This trend is not surprising given the previous visualization. Wells Fargo and Goldman Sachs, two of the companies with the greatest increase in RQ score between 2017 and 2022 are in the Financial Services industry, while the industry with the greatest decrease in mean RQ score between 2017 and 2022 was the Pharma industry, with the Media industry facing a similar decline. Facebook, Walt Disney, and Johnson & Johnson, the three companies with the greatest declines in RQ score between 2017 and 2022, are all either in the Media or Pharma industry, so this trend makes sense given the previous visualization. Mean RQ values for Financial Services and Tech industries generally fell below the range of values represented by the trendline and confidence interval for company RQ scores. Mean RQ values for the media industry generally were above the trendline and confidence interval for mean RQ scores. Most of the Mean RQ scores for the Pharma industry fell within the range of values for the company confidence interval.
Footnotes
Axios. (2022, May 24). The 2022 Axios Harris Poll 100 reputation rankings. Axios. Retrieved February 22, 2023, from https://www.axios.com/2022/05/24/2022-axios-harris-poll-100-rankings↩︎